

An Embedded ANN Raspberry PI
379
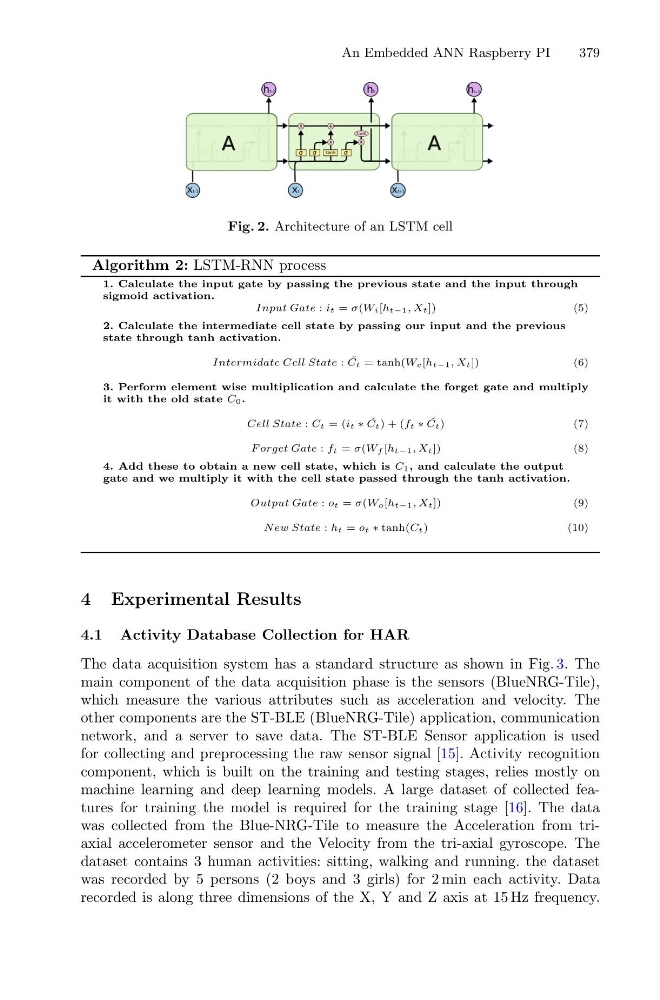
Fig. 2. Architecture of an LSTM cell
Algorithm 2: LSTM-RNN process
1. Calculate the input gate by passing the previous state and the input through
sigmoid activation.
Input Gate : it = σ(Wi[ht−1, Xt])
(5)
2. Calculate the intermediate cell state by passing our input and the previous
state through tanh activation.
Intermidate Cell State : ˇ
Ct = tanh(Wc[ht−1, Xt])
(6)
3. Perform element wise multiplication and calculate the forget gate and multiply
it with the old state C0.
Cell State : Ct = (it ∗ ˇ
Ct) + (ft ∗ ˇ
Ct)
( 7 )
F orget Gate : ft = σ(W f [ht−1, Xt])
(8)
4. Add these to obtain a new cell state, which is C1, and calculate the output
gate and we multiply it with the cell state passed through the tanh activation.
Output Gate : ot = σ(Wo[ht−1, Xt])
(9)
N ew State : ht = ot ∗ tanh(Ct)
(10)
4 Experimental Results
4.1 Activity Database Collection for HAR
The data acquisition system has a standard structure as shown in Fig. 3. The
main component of the data acquisition phase is the sensors (BlueNRG-Tile),
which measure the various attributes such as acceleration and velocity. The
other components are the ST-BLE (BlueNRG-Tile) application, communication
network, and a server to save data. The ST-BLE Sensor application is used
for collecting and preprocessing the raw sensor signal [15]. Activity recognition
component, which is built on the training and testing stages, relies mostly on
machine learning and deep learning models. A large dataset of collected features for training the model is required for the training stage [16]. The data
was collected from the Blue-NRG-Tile to measure the Acceleration from triaxial accelerometer sensor and the Velocity from the tri-axial gyroscope. The
dataset contains 3 human activities: sitting, walking and running. the dataset
was recorded by 5 persons (2 boys and 3 girls) for 2 min each activity. Data
recorded is along three dimensions of the X, Y and Z axis at 15 Hz frequency.
379
Fig. 2. Architecture of an LSTM cell
Algorithm 2: LSTM-RNN process
1. Calculate the input gate by passing the previous state and the input through
sigmoid activation.
Input Gate : it = σ(Wi[ht−1, Xt])
(5)
2. Calculate the intermediate cell state by passing our input and the previous
state through tanh activation.
Intermidate Cell State : ˇ
Ct = tanh(Wc[ht−1, Xt])
(6)
3. Perform element wise multiplication and calculate the forget gate and multiply
it with the old state C0.
Cell State : Ct = (it ∗ ˇ
Ct) + (ft ∗ ˇ
Ct)
( 7 )
F orget Gate : ft = σ(W f [ht−1, Xt])
(8)
4. Add these to obtain a new cell state, which is C1, and calculate the output
gate and we multiply it with the cell state passed through the tanh activation.
Output Gate : ot = σ(Wo[ht−1, Xt])
(9)
N ew State : ht = ot ∗ tanh(Ct)
(10)
4 Experimental Results
4.1 Activity Database Collection for HAR
The data acquisition system has a standard structure as shown in Fig. 3. The
main component of the data acquisition phase is the sensors (BlueNRG-Tile),
which measure the various attributes such as acceleration and velocity. The
other components are the ST-BLE (BlueNRG-Tile) application, communication
network, and a server to save data. The ST-BLE Sensor application is used
for collecting and preprocessing the raw sensor signal [15]. Activity recognition
component, which is built on the training and testing stages, relies mostly on
machine learning and deep learning models. A large dataset of collected features for training the model is required for the training stage [16]. The data
was collected from the Blue-NRG-Tile to measure the Acceleration from triaxial accelerometer sensor and the Velocity from the tri-axial gyroscope. The
dataset contains 3 human activities: sitting, walking and running. the dataset
was recorded by 5 persons (2 boys and 3 girls) for 2 min each activity. Data
recorded is along three dimensions of the X, Y and Z axis at 15 Hz frequency.