

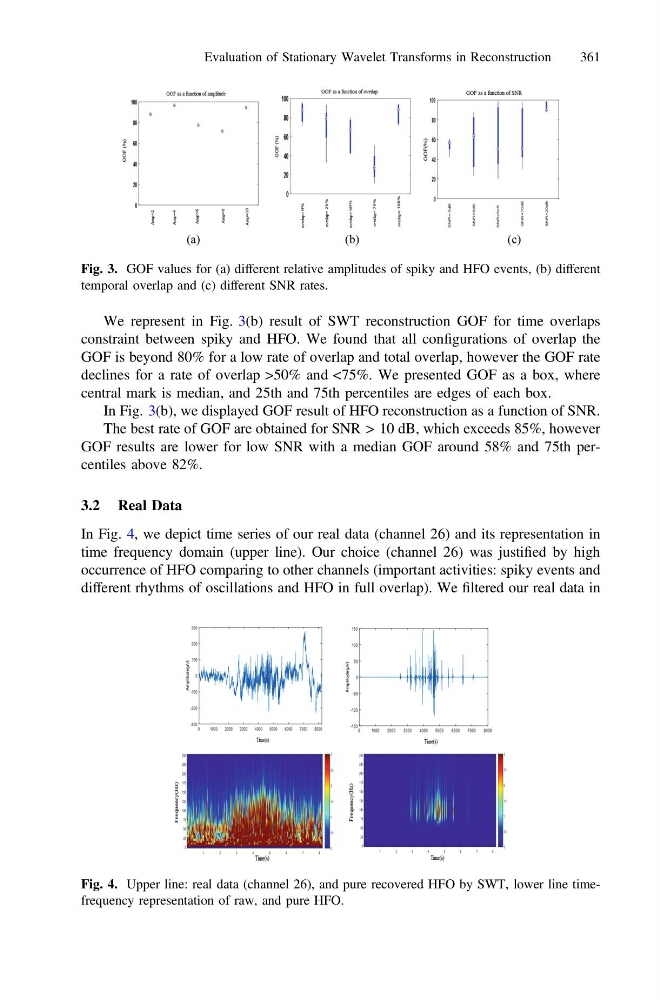
We represent in Fig. 3(b) result of SWT reconstruction GOF for time overlaps
constraint between spiky and HFO. We found that all configurations of overlap the
GOF is beyond 80% for a low rate of overlap and total overlap, however the GOF rate
declines for a rate of overlap >50% and <75%. We presented GOF as a box, where
central mark is median, and 25th and 75th percentiles are edges of each box.
In Fig. 3(b), we displayed GOF result of HFO reconstruction as a function of SNR.
The best rate of GOF are obtained for SNR > 10 dB, which exceeds 85%, however
GOF results are lower for low SNR with a median GOF around 58% and 75th percentiles above 82%.
3.2 Real Data
In Fig. 4, we depict time series of our real data (channel 26) and its representation in
time frequency domain (upper line). Our choice (channel 26) was justified by high
occurrence of HFO comparing to other channels (important activities: spiky events and
different rhythms of oscillations and HFO in full overlap). We filtered our real data in
Fig. 3. GOF values for (a) different relative amplitudes of spiky and HFO events, (b) different
temporal overlap and (c) different SNR rates.
Fig. 4. Upper line: real data (channel 26), and pure recovered HFO by SWT, lower line timefrequency representation of raw, and pure HFO.
Evaluation of Stationary Wavelet Transforms in Reconstruction
361
constraint between spiky and HFO. We found that all configurations of overlap the
GOF is beyond 80% for a low rate of overlap and total overlap, however the GOF rate
declines for a rate of overlap >50% and <75%. We presented GOF as a box, where
central mark is median, and 25th and 75th percentiles are edges of each box.
In Fig. 3(b), we displayed GOF result of HFO reconstruction as a function of SNR.
The best rate of GOF are obtained for SNR > 10 dB, which exceeds 85%, however
GOF results are lower for low SNR with a median GOF around 58% and 75th percentiles above 82%.
3.2 Real Data
In Fig. 4, we depict time series of our real data (channel 26) and its representation in
time frequency domain (upper line). Our choice (channel 26) was justified by high
occurrence of HFO comparing to other channels (important activities: spiky events and
different rhythms of oscillations and HFO in full overlap). We filtered our real data in
Fig. 3. GOF values for (a) different relative amplitudes of spiky and HFO events, (b) different
temporal overlap and (c) different SNR rates.
Fig. 4. Upper line: real data (channel 26), and pure recovered HFO by SWT, lower line timefrequency representation of raw, and pure HFO.
Evaluation of Stationary Wavelet Transforms in Reconstruction
361