

12
B. Solano-Rojas et al.
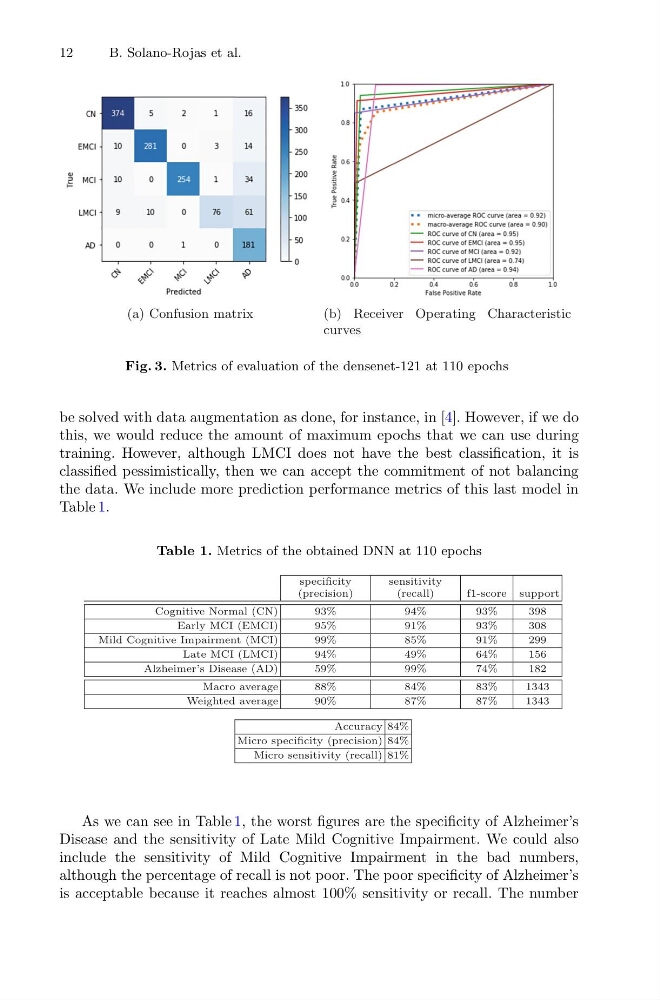
(a) Confusion matrix
(b) Receiver Operating Characteristic
curves
Fig. 3. Metrics of evaluation of the densenet-121 at 110 epochs
be solved with data augmentation as done, for instance, in [4]. However, if we do
this, we would reduce the amount of maximum epochs that we can use during
training. However, although LMCI does not have the best classification, it is
classified pessimistically, then we can accept the commitment of not balancing
the data. We include more prediction performance metrics of this last model in
Table 1.
Table 1. Metrics of the obtained DNN at 110 epochs
specificity
(precision)
sensitivity
(recall)
f1-score support
Cognitive Normal (CN)
93%
94%
93%
398
Early MCI (EMCI)
95%
91%
93%
308
Mild Cognitive Impairment (MCI)
99%
85%
91%
299
Late MCI (LMCI)
94%
49%
64%
156
Alzheimer’s Disease (AD)
59%
99%
74%
182
Macro average
88%
84%
83%
1343
Weighted average
90%
87%
87%
1343
Accuracy 84%
Micro specificity (precision) 84%
Micro sensitivity (recall) 81%
As we can see in Table 1, the worst figures are the specificity of Alzheimer’s
Disease and the sensitivity of Late Mild Cognitive Impairment. We could also
include the sensitivity of Mild Cognitive Impairment in the bad numbers,
although the percentage of recall is not poor. The poor specificity of Alzheimer’s
is acceptable because it reaches almost 100% sensitivity or recall. The number
B. Solano-Rojas et al.
(a) Confusion matrix
(b) Receiver Operating Characteristic
curves
Fig. 3. Metrics of evaluation of the densenet-121 at 110 epochs
be solved with data augmentation as done, for instance, in [4]. However, if we do
this, we would reduce the amount of maximum epochs that we can use during
training. However, although LMCI does not have the best classification, it is
classified pessimistically, then we can accept the commitment of not balancing
the data. We include more prediction performance metrics of this last model in
Table 1.
Table 1. Metrics of the obtained DNN at 110 epochs
specificity
(precision)
sensitivity
(recall)
f1-score support
Cognitive Normal (CN)
93%
94%
93%
398
Early MCI (EMCI)
95%
91%
93%
308
Mild Cognitive Impairment (MCI)
99%
85%
91%
299
Late MCI (LMCI)
94%
49%
64%
156
Alzheimer’s Disease (AD)
59%
99%
74%
182
Macro average
88%
84%
83%
1343
Weighted average
90%
87%
87%
1343
Accuracy 84%
Micro specificity (precision) 84%
Micro sensitivity (recall) 81%
As we can see in Table 1, the worst figures are the specificity of Alzheimer’s
Disease and the sensitivity of Late Mild Cognitive Impairment. We could also
include the sensitivity of Mild Cognitive Impairment in the bad numbers,
although the percentage of recall is not poor. The poor specificity of Alzheimer’s
is acceptable because it reaches almost 100% sensitivity or recall. The number