

ULTech to Observe Elderly’s Behavior Changes over Time in SH
137
Fig. 3. Normal behavior pattern
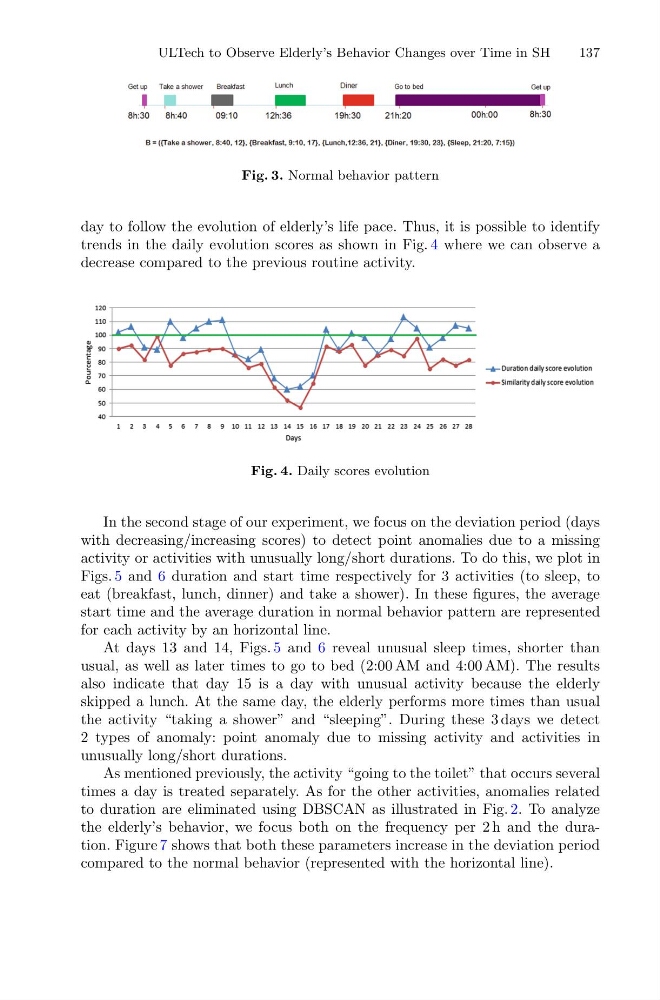
day to follow the evolution of elderly’s life pace. Thus, it is possible to identify
trends in the daily evolution scores as shown in Fig. 4 where we can observe a
decrease compared to the previous routine activity.
Fig. 4. Daily scores evolution
In the second stage of our experiment, we focus on the deviation period (days
with decreasing/increasing scores) to detect point anomalies due to a missing
activity or activities with unusually long/short durations. To do this, we plot in
Figs. 5 and 6 duration and start time respectively for 3 activities (to sleep, to
eat (breakfast, lunch, dinner) and take a shower). In these figures, the average
start time and the average duration in normal behavior pattern are represented
for each activity by an horizontal line.
At days 13 and 14, Figs. 5 and 6 reveal unusual sleep times, shorter than
usual, as well as later times to go to bed (2:00 AM and 4:00 AM). The results
also indicate that day 15 is a day with unusual activity because the elderly
skipped a lunch. At the same day, the elderly performs more times than usual
the activity “taking a shower” and “sleeping”. During these 3 days we detect
2 types of anomaly: point anomaly due to missing activity and activities in
unusually long/short durations.
As mentioned previously, the activity “going to the toilet” that occurs several
times a day is treated separately. As for the other activities, anomalies related
to duration are eliminated using DBSCAN as illustrated in Fig. 2. To analyze
the elderly’s behavior, we focus both on the frequency per 2 h and the duration. Figure 7 shows that both these parameters increase in the deviation period
compared to the normal behavior (represented with the horizontal line).
137
Fig. 3. Normal behavior pattern
day to follow the evolution of elderly’s life pace. Thus, it is possible to identify
trends in the daily evolution scores as shown in Fig. 4 where we can observe a
decrease compared to the previous routine activity.
Fig. 4. Daily scores evolution
In the second stage of our experiment, we focus on the deviation period (days
with decreasing/increasing scores) to detect point anomalies due to a missing
activity or activities with unusually long/short durations. To do this, we plot in
Figs. 5 and 6 duration and start time respectively for 3 activities (to sleep, to
eat (breakfast, lunch, dinner) and take a shower). In these figures, the average
start time and the average duration in normal behavior pattern are represented
for each activity by an horizontal line.
At days 13 and 14, Figs. 5 and 6 reveal unusual sleep times, shorter than
usual, as well as later times to go to bed (2:00 AM and 4:00 AM). The results
also indicate that day 15 is a day with unusual activity because the elderly
skipped a lunch. At the same day, the elderly performs more times than usual
the activity “taking a shower” and “sleeping”. During these 3 days we detect
2 types of anomaly: point anomaly due to missing activity and activities in
unusually long/short durations.
As mentioned previously, the activity “going to the toilet” that occurs several
times a day is treated separately. As for the other activities, anomalies related
to duration are eliminated using DBSCAN as illustrated in Fig. 2. To analyze
the elderly’s behavior, we focus both on the frequency per 2 h and the duration. Figure 7 shows that both these parameters increase in the deviation period
compared to the normal behavior (represented with the horizontal line).