

302
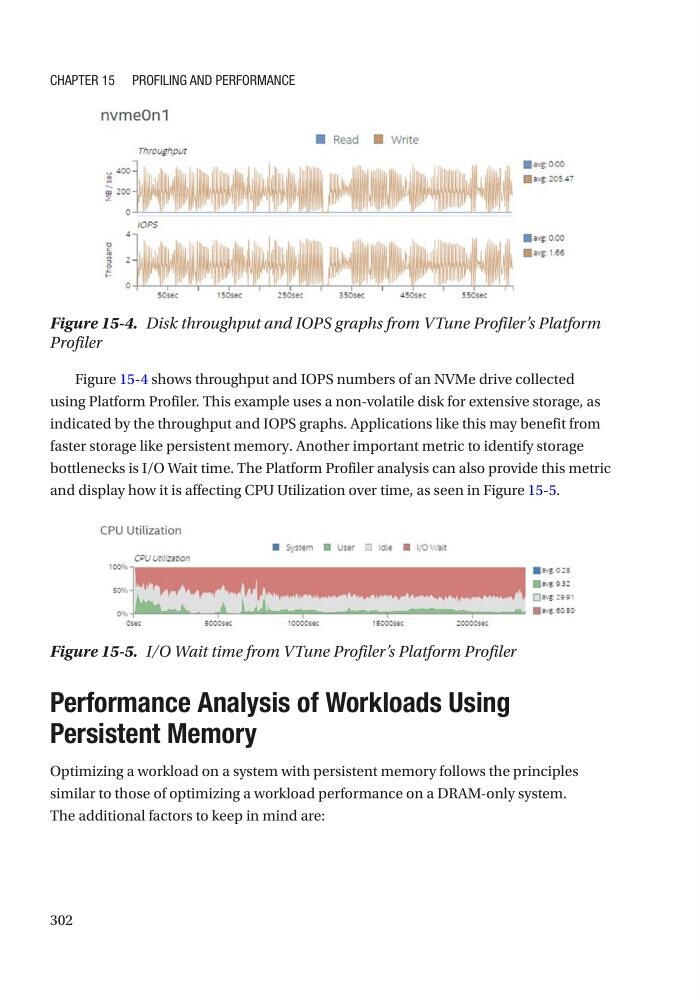
Figure 15-4 shows throughput and IOPS numbers of an NVMe drive collected
using Platform Profiler. This example uses a non-volatile disk for extensive storage, as
indicated by the throughput and IOPS graphs. Applications like this may benefit from
faster storage like persistent memory. Another important metric to identify storage
bottlenecks is I/O Wait time. The Platform Profiler analysis can also provide this metric
and display how it is affecting CPU Utilization over time, as seen in Figure 15-5.
Performance Analysis of Workloads Using
Persistent Memory
Optimizing a workload on a system with persistent memory follows the principles
similar to those of optimizing a workload performance on a DRAM-only system.
The additional factors to keep in mind are:
Figure 15-4. Disk throughput and IOPS graphs from VTune Profiler’s Platform
Profiler
Figure 15-5. I/O Wait time from VTune Profiler’s Platform Profiler
Chapter 15 profiling and performanCe
Figure 15-4 shows throughput and IOPS numbers of an NVMe drive collected
using Platform Profiler. This example uses a non-volatile disk for extensive storage, as
indicated by the throughput and IOPS graphs. Applications like this may benefit from
faster storage like persistent memory. Another important metric to identify storage
bottlenecks is I/O Wait time. The Platform Profiler analysis can also provide this metric
and display how it is affecting CPU Utilization over time, as seen in Figure 15-5.
Performance Analysis of Workloads Using
Persistent Memory
Optimizing a workload on a system with persistent memory follows the principles
similar to those of optimizing a workload performance on a DRAM-only system.
The additional factors to keep in mind are:
Figure 15-4. Disk throughput and IOPS graphs from VTune Profiler’s Platform
Profiler
Figure 15-5. I/O Wait time from VTune Profiler’s Platform Profiler
Chapter 15 profiling and performanCe