

301
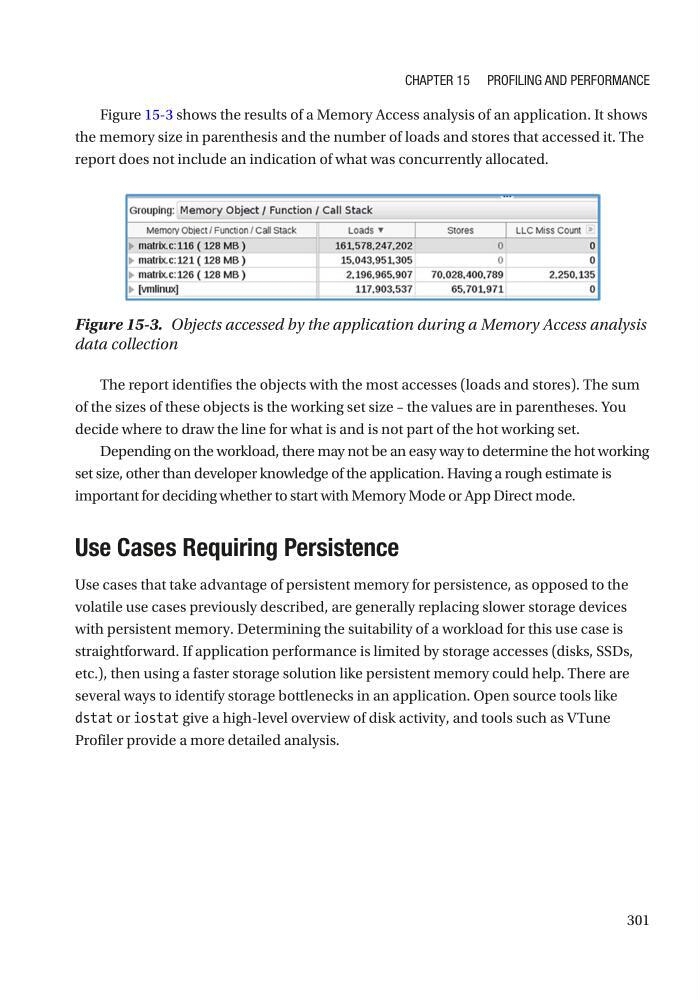
Figure 15-3 shows the results of a Memory Access analysis of an application. It shows
the memory size in parenthesis and the number of loads and stores that accessed it. The
report does not include an indication of what was concurrently allocated.
The report identifies the objects with the most accesses (loads and stores). The sum
of the sizes of these objects is the working set size – the values are in parentheses. You
decide where to draw the line for what is and is not part of the hot working set.
Depending on the workload, there may not be an easy way to determine the hot working
set size, other than developer knowledge of the application. Having a rough estimate is
important for deciding whether to start with Memory Mode or App Direct mode.
Use Cases Requiring Persistence
Use cases that take advantage of persistent memory for persistence, as opposed to the
volatile use cases previously described, are generally replacing slower storage devices
with persistent memory. Determining the suitability of a workload for this use case is
straightforward. If application performance is limited by storage accesses (disks, SSDs,
etc.), then using a faster storage solution like persistent memory could help. There are
several ways to identify storage bottlenecks in an application. Open source tools like
dstat or iostat give a high-level overview of disk activity, and tools such as VTune
Profiler provide a more detailed analysis.
Figure 15-3. Objects accessed by the application during a Memory Access analysis
data collection
Chapter 15 profiling and performanCe
Figure 15-3 shows the results of a Memory Access analysis of an application. It shows
the memory size in parenthesis and the number of loads and stores that accessed it. The
report does not include an indication of what was concurrently allocated.
The report identifies the objects with the most accesses (loads and stores). The sum
of the sizes of these objects is the working set size – the values are in parentheses. You
decide where to draw the line for what is and is not part of the hot working set.
Depending on the workload, there may not be an easy way to determine the hot working
set size, other than developer knowledge of the application. Having a rough estimate is
important for deciding whether to start with Memory Mode or App Direct mode.
Use Cases Requiring Persistence
Use cases that take advantage of persistent memory for persistence, as opposed to the
volatile use cases previously described, are generally replacing slower storage devices
with persistent memory. Determining the suitability of a workload for this use case is
straightforward. If application performance is limited by storage accesses (disks, SSDs,
etc.), then using a faster storage solution like persistent memory could help. There are
several ways to identify storage bottlenecks in an application. Open source tools like
dstat or iostat give a high-level overview of disk activity, and tools such as VTune
Profiler provide a more detailed analysis.
Figure 15-3. Objects accessed by the application during a Memory Access analysis
data collection
Chapter 15 profiling and performanCe