

213
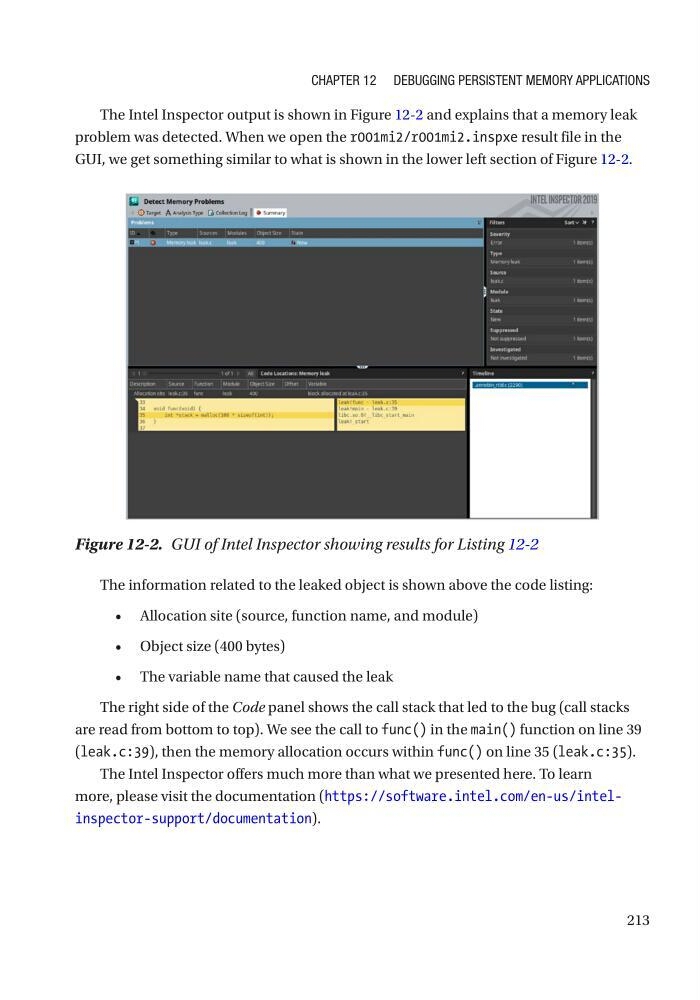
The Intel Inspector output is shown in Figure 12-2 and explains that a memory leak
problem was detected. When we open the r001mi2/r001mi2.inspxe result file in the
GUI, we get something similar to what is shown in the lower left section of Figure 12-2.
The information related to the leaked object is shown above the code listing:
• Allocation site (source, function name, and module)
• Object size (400 bytes)
• The variable name that caused the leak
The right side of the Code panel shows the call stack that led to the bug (call stacks
are read from bottom to top). We see the call to func() in the main() function on line 39
(leak.c:39), then the memory allocation occurs within func() on line 35 (leak.c:35).
The Intel Inspector offers much more than what we presented here. To learn
more, please visit the documentation (https://software.intel.com/en-us/intelinspector-support/documentation).
Figure 12-2. GUI of Intel Inspector showing results for Listing 12-2
Chapter 12 Debugging persistent MeMory appliCations
The Intel Inspector output is shown in Figure 12-2 and explains that a memory leak
problem was detected. When we open the r001mi2/r001mi2.inspxe result file in the
GUI, we get something similar to what is shown in the lower left section of Figure 12-2.
The information related to the leaked object is shown above the code listing:
• Allocation site (source, function name, and module)
• Object size (400 bytes)
• The variable name that caused the leak
The right side of the Code panel shows the call stack that led to the bug (call stacks
are read from bottom to top). We see the call to func() in the main() function on line 39
(leak.c:39), then the memory allocation occurs within func() on line 35 (leak.c:35).
The Intel Inspector offers much more than what we presented here. To learn
more, please visit the documentation (https://software.intel.com/en-us/intelinspector-support/documentation).
Figure 12-2. GUI of Intel Inspector showing results for Listing 12-2
Chapter 12 Debugging persistent MeMory appliCations