

212
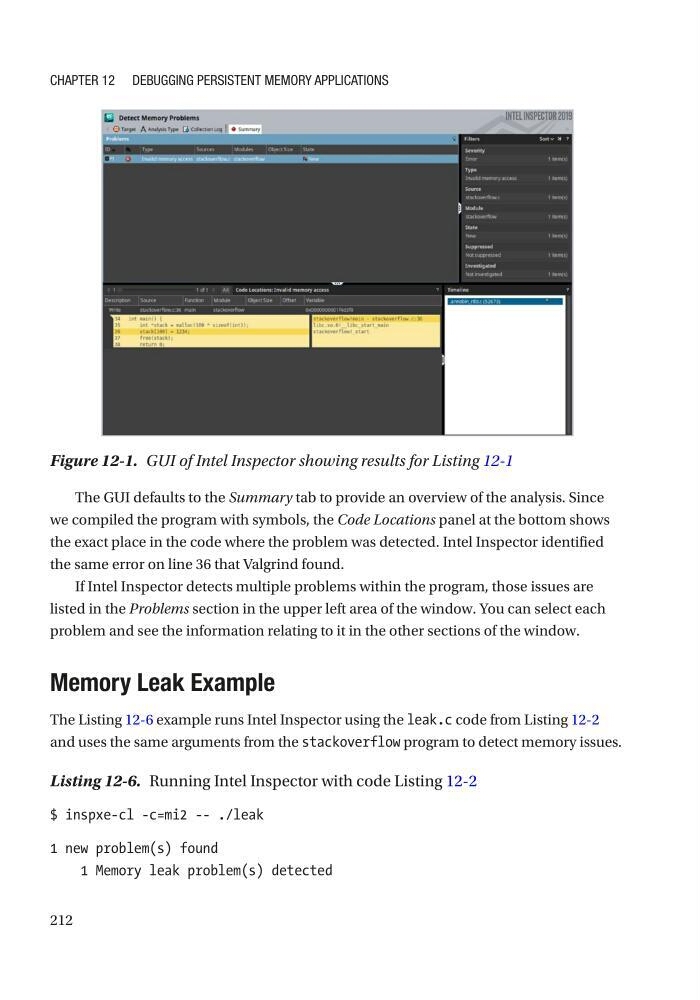
The GUI defaults to the Summary tab to provide an overview of the analysis. Since
we compiled the program with symbols, the Code Locations panel at the bottom shows
the exact place in the code where the problem was detected. Intel Inspector identified
the same error on line 36 that Valgrind found.
If Intel Inspector detects multiple problems within the program, those issues are
listed in the Problems section in the upper left area of the window. You can select each
problem and see the information relating to it in the other sections of the window.
Memory Leak Example
The Listing 12-6 example runs Intel Inspector using the leak.c code from Listing 12-2
and uses the same arguments from the stackoverflow program to detect memory issues.
Listing 12-6. Running Intel Inspector with code Listing 12-2
$ inspxe-cl -c=mi2 -- ./leak
1 new problem(s) found
1 Memory leak problem(s) detected
Figure 12-1. GUI of Intel Inspector showing results for Listing 12-1
Chapter 12 Debugging persistent MeMory appliCations
The GUI defaults to the Summary tab to provide an overview of the analysis. Since
we compiled the program with symbols, the Code Locations panel at the bottom shows
the exact place in the code where the problem was detected. Intel Inspector identified
the same error on line 36 that Valgrind found.
If Intel Inspector detects multiple problems within the program, those issues are
listed in the Problems section in the upper left area of the window. You can select each
problem and see the information relating to it in the other sections of the window.
Memory Leak Example
The Listing 12-6 example runs Intel Inspector using the leak.c code from Listing 12-2
and uses the same arguments from the stackoverflow program to detect memory issues.
Listing 12-6. Running Intel Inspector with code Listing 12-2
$ inspxe-cl -c=mi2 -- ./leak
1 new problem(s) found
1 Memory leak problem(s) detected
Figure 12-1. GUI of Intel Inspector showing results for Listing 12-1
Chapter 12 Debugging persistent MeMory appliCations