

Population Viability Analysis
317
by Pennycuick et al. (1968), Usher (1972), and Beddington (1974), taken
from May and Oster (1976):
N t +1 =
by Beverton and Holt (1957) and Ricker (1975):
N t +1 = ᎏ
ρ + (
1
k /N t )
ᎏ
and by Maynard-Smith and Slatkin (1973):
λN t
ᎏᎏᎏ
1 + exp[– A(1 – N t /B)]
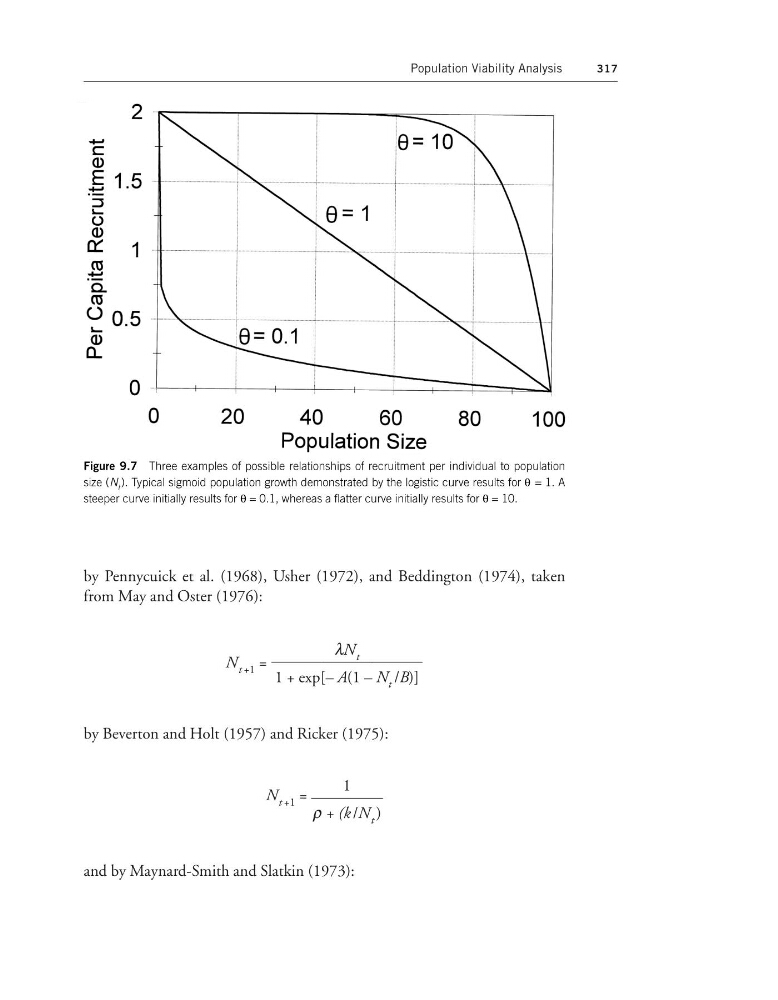
Figure 9.7 Three examples of possible relationships of recruitment per individual to population
size (N t ). Typical sigmoid population growth demonstrated by the logistic curve results for θ = 1. A
steeper curve initially results for θ = 0.1, whereas a flatter curve initially results for θ = 10.
317
by Pennycuick et al. (1968), Usher (1972), and Beddington (1974), taken
from May and Oster (1976):
N t +1 =
by Beverton and Holt (1957) and Ricker (1975):
N t +1 = ᎏ
ρ + (
1
k /N t )
ᎏ
and by Maynard-Smith and Slatkin (1973):
λN t
ᎏᎏᎏ
1 + exp[– A(1 – N t /B)]
Figure 9.7 Three examples of possible relationships of recruitment per individual to population
size (N t ). Typical sigmoid population growth demonstrated by the logistic curve results for θ = 1. A
steeper curve initially results for θ = 0.1, whereas a flatter curve initially results for θ = 10.