

269
giving up its “agricultural Zionistic ideal” despite the negligible economic importance of the agricultural sector which counts for only 1.4 % of Israel’s GDP.
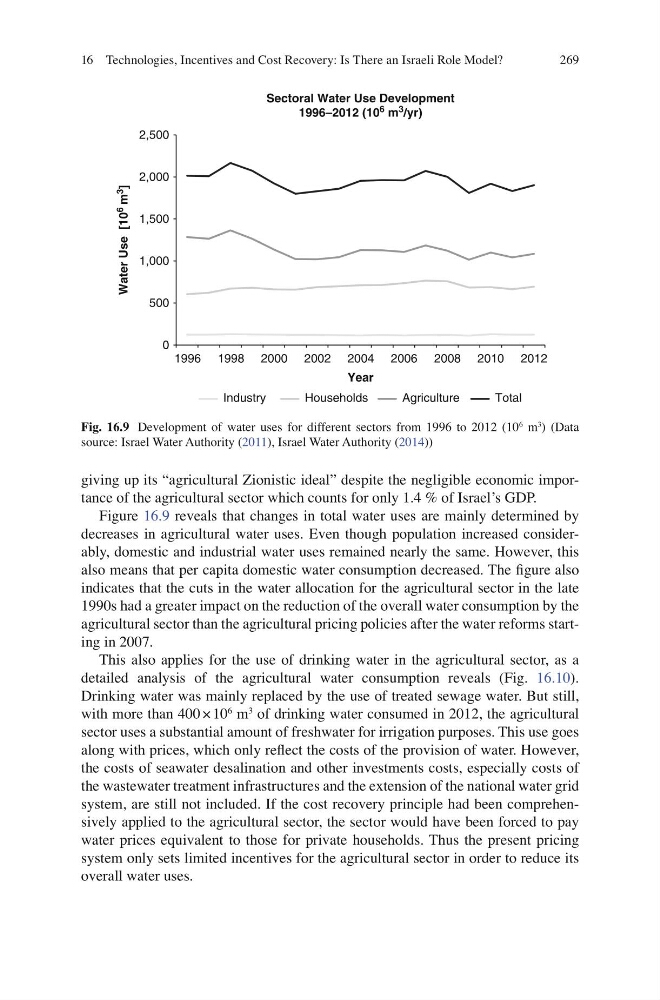
Figure 16.9 reveals that changes in total water uses are mainly determined by
decreases in agricultural water uses. Even though population increased considerably, domestic and industrial water uses remained nearly the same. However, this
also means that per capita domestic water consumption decreased. The fi gure also
indicates that the cuts in the water allocation for the agricultural sector in the late
1990s had a greater impact on the reduction of the overall water consumption by the
agricultural sector than the agricultural pricing policies after the water reforms starting in 2007.
This also applies for the use of drinking water in the agricultural sector, as a
detailed analysis of the agricultural water consumption reveals (Fig. 16.10 ).
Drinking water was mainly replaced by the use of treated sewage water. But still,
with more than 400 × 10
6 m
3 of drinking water consumed in 2012, the agricultural
sector uses a substantial amount of freshwater for irrigation purposes. This use goes
along with prices, which only refl ect the costs of the provision of water. However,
the costs of seawater desalination and other investments costs, especially costs of
the wastewater treatment infrastructures and the extension of the national water grid
system, are still not included. If the cost recovery principle had been comprehensively applied to the agricultural sector, the sector would have been forced to pay
water prices equivalent to those for private households. Thus the present pricing
system only sets limited incentives for the agricultural sector in order to reduce its
overall water uses.
0
500
1,000
1,500
2,000
2,500
1996 1998 2000 2002 2004 2006 2008 2010 2012
Water Use [10
6
m
3
]
Year
Industry
Households
Agriculture
Total
Sectoral Water Use Development
1996–2012 (10
6 m
3 /yr)
Fig. 16.9 Development of water uses for different sectors from 1996 to 2012 (10
6 m
3
) (Data
source: Israel Water Authority ( 2011 ), Israel Water Authority ( 2014 ))
16 Technologies, Incentives and Cost Recovery: Is There an Israeli Role Model?
giving up its “agricultural Zionistic ideal” despite the negligible economic importance of the agricultural sector which counts for only 1.4 % of Israel’s GDP.
Figure 16.9 reveals that changes in total water uses are mainly determined by
decreases in agricultural water uses. Even though population increased considerably, domestic and industrial water uses remained nearly the same. However, this
also means that per capita domestic water consumption decreased. The fi gure also
indicates that the cuts in the water allocation for the agricultural sector in the late
1990s had a greater impact on the reduction of the overall water consumption by the
agricultural sector than the agricultural pricing policies after the water reforms starting in 2007.
This also applies for the use of drinking water in the agricultural sector, as a
detailed analysis of the agricultural water consumption reveals (Fig. 16.10 ).
Drinking water was mainly replaced by the use of treated sewage water. But still,
with more than 400 × 10
6 m
3 of drinking water consumed in 2012, the agricultural
sector uses a substantial amount of freshwater for irrigation purposes. This use goes
along with prices, which only refl ect the costs of the provision of water. However,
the costs of seawater desalination and other investments costs, especially costs of
the wastewater treatment infrastructures and the extension of the national water grid
system, are still not included. If the cost recovery principle had been comprehensively applied to the agricultural sector, the sector would have been forced to pay
water prices equivalent to those for private households. Thus the present pricing
system only sets limited incentives for the agricultural sector in order to reduce its
overall water uses.
0
500
1,000
1,500
2,000
2,500
1996 1998 2000 2002 2004 2006 2008 2010 2012
Water Use [10
6
m
3
]
Year
Industry
Households
Agriculture
Total
Sectoral Water Use Development
1996–2012 (10
6 m
3 /yr)
Fig. 16.9 Development of water uses for different sectors from 1996 to 2012 (10
6 m
3
) (Data
source: Israel Water Authority ( 2011 ), Israel Water Authority ( 2014 ))
16 Technologies, Incentives and Cost Recovery: Is There an Israeli Role Model?