

211
Dead Sea will be increased gradually over a period of time (TAHAL and GSI 2011 ).
We therefore focus on the surface pipeline option.
6
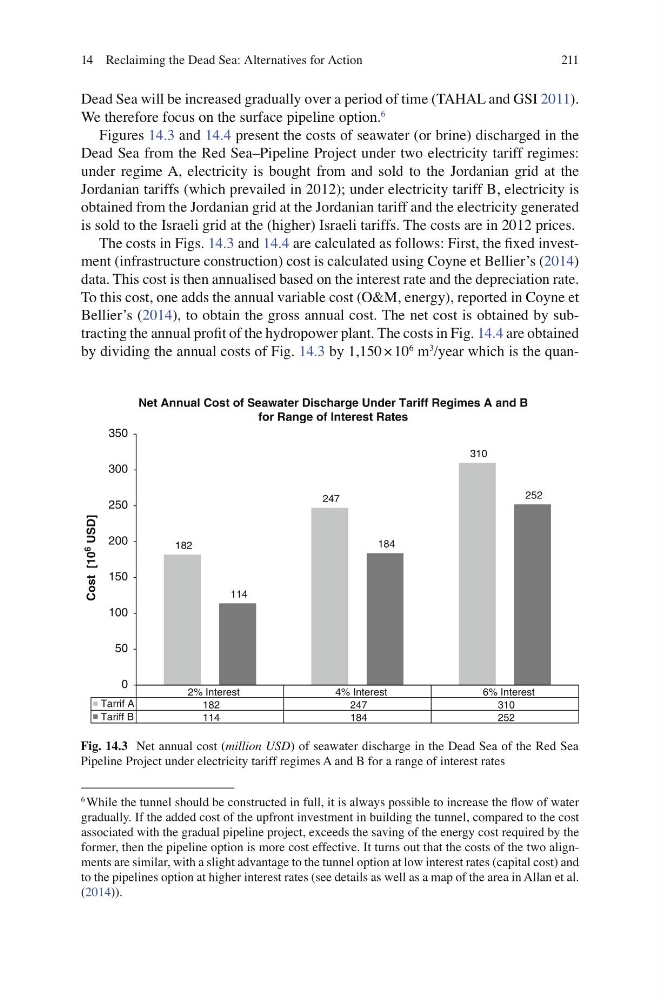
Figures 14.3 and 14.4 present the costs of seawater (or brine) discharged in the
Dead Sea from the Red Sea–Pipeline Project under two electricity tariff regimes:
under regime A, electricity is bought from and sold to the Jordanian grid at the
Jordanian tariffs (which prevailed in 2012); under electricity tariff B, electricity is
obtained from the Jordanian grid at the Jordanian tariff and the electricity generated
is sold to the Israeli grid at the (higher) Israeli tariffs. The costs are in 2012 prices.
The costs in Figs. 14.3 and 14.4 are calculated as follows: First, the fi xed investment (infrastructure construction) cost is calculated using Coyne et Bellier’s ( 2014 )
data. This cost is then annualised based on the interest rate and the depreciation rate.
To this cost, one adds the annual variable cost (O&M, energy), reported in Coyne et
Bellier’s ( 2014 ), to obtain the gross annual cost. The net cost is obtained by subtracting the annual profi t of the hydropower plant. The costs in Fig. 14.4 are obtained
by dividing the annual costs of Fig. 14.3 by 1,150 × 10
6 m
3
/year which is the quan6 While the tunnel should be constructed in full, it is always possible to increase the fl ow of water
gradually. If the added cost of the upfront investment in building the tunnel, compared to the cost
associated with the gradual pipeline project, exceeds the saving of the energy cost required by the
former, then the pipeline option is more cost effective. It turns out that the costs of the two alignments are similar, with a slight advantage to the tunnel option at low interest rates (capital cost) and
to the pipelines option at higher interest rates (see details as well as a map of the area in Allan et al.
( 2014 )).
2% Interest
4% Interest
6% Interest
Tarrif A
182
247
310
Tariff B
114
184
252
182
247
310
114
184
252
0
50
100
150
200
250
300
350
Net Annual Cost of Seawater Discharge Under Tariff Regimes A and B
for Range of Interest Rates
Cost [10
6
USD]
Fig. 14.3 Net annual cost ( million USD ) of seawater discharge in the Dead Sea of the Red Sea
Pipeline Project under electricity tariff regimes A and B for a range of interest rates
14 Reclaiming the Dead Sea: Alternatives for Action
Dead Sea will be increased gradually over a period of time (TAHAL and GSI 2011 ).
We therefore focus on the surface pipeline option.
6
Figures 14.3 and 14.4 present the costs of seawater (or brine) discharged in the
Dead Sea from the Red Sea–Pipeline Project under two electricity tariff regimes:
under regime A, electricity is bought from and sold to the Jordanian grid at the
Jordanian tariffs (which prevailed in 2012); under electricity tariff B, electricity is
obtained from the Jordanian grid at the Jordanian tariff and the electricity generated
is sold to the Israeli grid at the (higher) Israeli tariffs. The costs are in 2012 prices.
The costs in Figs. 14.3 and 14.4 are calculated as follows: First, the fi xed investment (infrastructure construction) cost is calculated using Coyne et Bellier’s ( 2014 )
data. This cost is then annualised based on the interest rate and the depreciation rate.
To this cost, one adds the annual variable cost (O&M, energy), reported in Coyne et
Bellier’s ( 2014 ), to obtain the gross annual cost. The net cost is obtained by subtracting the annual profi t of the hydropower plant. The costs in Fig. 14.4 are obtained
by dividing the annual costs of Fig. 14.3 by 1,150 × 10
6 m
3
/year which is the quan6 While the tunnel should be constructed in full, it is always possible to increase the fl ow of water
gradually. If the added cost of the upfront investment in building the tunnel, compared to the cost
associated with the gradual pipeline project, exceeds the saving of the energy cost required by the
former, then the pipeline option is more cost effective. It turns out that the costs of the two alignments are similar, with a slight advantage to the tunnel option at low interest rates (capital cost) and
to the pipelines option at higher interest rates (see details as well as a map of the area in Allan et al.
( 2014 )).
2% Interest
4% Interest
6% Interest
Tarrif A
182
247
310
Tariff B
114
184
252
182
247
310
114
184
252
0
50
100
150
200
250
300
350
Net Annual Cost of Seawater Discharge Under Tariff Regimes A and B
for Range of Interest Rates
Cost [10
6
USD]
Fig. 14.3 Net annual cost ( million USD ) of seawater discharge in the Dead Sea of the Red Sea
Pipeline Project under electricity tariff regimes A and B for a range of interest rates
14 Reclaiming the Dead Sea: Alternatives for Action