

195
To compensate for a part of the defi cit, Jordan used 91 × 10
6 m
3 from nonrenewable groundwater sources in 2007. The most prominent aquifer is the “Disi” aquifer,
a transboundary fossil groundwater resource shared with Saudi Arabia.
13.1.3 Environmental Consequences of Current Water Uses
Salt water intrusion to the coastal aquifers, signifi cant decreases in the groundwater
levels and resulting rising salinity levels were some of the hidden consequences of
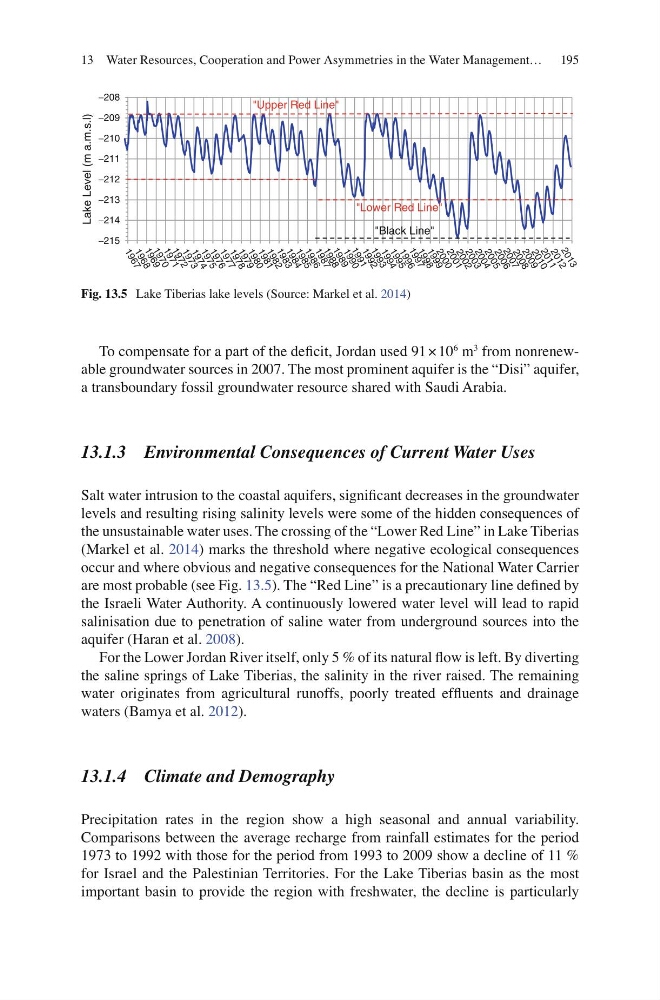
the unsustainable water uses. The crossing of the “Lower Red Line” in Lake Tiberias
(Markel et al. 2014 ) marks the threshold where negative ecological consequences
occur and where obvious and negative consequences for the National Water Carrier
are most probable (see Fig. 13.5 ). The “Red Line” is a precautionary line defi ned by
the Israeli Water Authority. A continuously lowered water level will lead to rapid
salinisation due to penetration of saline water from underground sources into the
aquifer (Haran et al. 2008 ).
For the Lower Jordan River itself, only 5 % of its natural fl ow is left. By diverting
the saline springs of Lake Tiberias, the salinity in the river raised. The remaining
water originates from agricultural runoffs, poorly treated effl uents and drainage
waters (Bamya et al. 2012 ).
13.1.4 Climate and Demography
Precipitation rates in the region show a high seasonal and annual variability.
Comparisons between the average recharge from rainfall estimates for the period
1973 to 1992 with those for the period from 1993 to 2009 show a decline of 11 %
for Israel and the Palestinian Territories. For the Lake Tiberias basin as the most
important basin to provide the region with freshwater, the decline is particularly
−215
1
9
6
7 1
9
6
8 1
9
6
9 1
9
7
0 1
9
7
1 1
9
7
2 1
9
7
3 1
9
7
4 1
9
7
5 1
9
7
6 1
9
7
7 1
9
7
8 1
9
7
9 1
9
8
0 1 9
8
1 1 9 8 2 1 9 8 3 1 9 8 4 1 9 8 5 1 9 8 6 1 9 8 7 1 9 8 8 1 9 8 9 1 9 9 0
1 9 9 1 1 9 9 2 1 9 9 3 1 9 9 4 1 9 9 5 1 9 9 6 1 9 9 7 1 9 9 8 1 9 9 9 2 0 0 0 2 0 0 1 2 0 0 2 2 0 0 3 2 0 0 4 2 0 0 5 2 0 0 6 2 0 0 7 2 0 0 8 2 0 0 9 2 0 1 0 2 0 1 1 2 0 1 2 2 0 1 3
−214
−213
−212
−211
−210
−209
−208
Lake Level (m a.m.s.l)
"Upper Red Line"
"Lower Red Line"
"Black Line"
Fig. 13.5 Lake Tiberias lake levels (Source: Markel et al. 2014 )
13 Water Resources, Cooperation and Power Asymmetries in the Water Management…
To compensate for a part of the defi cit, Jordan used 91 × 10
6 m
3 from nonrenewable groundwater sources in 2007. The most prominent aquifer is the “Disi” aquifer,
a transboundary fossil groundwater resource shared with Saudi Arabia.
13.1.3 Environmental Consequences of Current Water Uses
Salt water intrusion to the coastal aquifers, signifi cant decreases in the groundwater
levels and resulting rising salinity levels were some of the hidden consequences of
the unsustainable water uses. The crossing of the “Lower Red Line” in Lake Tiberias
(Markel et al. 2014 ) marks the threshold where negative ecological consequences
occur and where obvious and negative consequences for the National Water Carrier
are most probable (see Fig. 13.5 ). The “Red Line” is a precautionary line defi ned by
the Israeli Water Authority. A continuously lowered water level will lead to rapid
salinisation due to penetration of saline water from underground sources into the
aquifer (Haran et al. 2008 ).
For the Lower Jordan River itself, only 5 % of its natural fl ow is left. By diverting
the saline springs of Lake Tiberias, the salinity in the river raised. The remaining
water originates from agricultural runoffs, poorly treated effl uents and drainage
waters (Bamya et al. 2012 ).
13.1.4 Climate and Demography
Precipitation rates in the region show a high seasonal and annual variability.
Comparisons between the average recharge from rainfall estimates for the period
1973 to 1992 with those for the period from 1993 to 2009 show a decline of 11 %
for Israel and the Palestinian Territories. For the Lake Tiberias basin as the most
important basin to provide the region with freshwater, the decline is particularly
−215
1
9
6
7 1
9
6
8 1
9
6
9 1
9
7
0 1
9
7
1 1
9
7
2 1
9
7
3 1
9
7
4 1
9
7
5 1
9
7
6 1
9
7
7 1
9
7
8 1
9
7
9 1
9
8
0 1 9
8
1 1 9 8 2 1 9 8 3 1 9 8 4 1 9 8 5 1 9 8 6 1 9 8 7 1 9 8 8 1 9 8 9 1 9 9 0
1 9 9 1 1 9 9 2 1 9 9 3 1 9 9 4 1 9 9 5 1 9 9 6 1 9 9 7 1 9 9 8 1 9 9 9 2 0 0 0 2 0 0 1 2 0 0 2 2 0 0 3 2 0 0 4 2 0 0 5 2 0 0 6 2 0 0 7 2 0 0 8 2 0 0 9 2 0 1 0 2 0 1 1 2 0 1 2 2 0 1 3
−214
−213
−212
−211
−210
−209
−208
Lake Level (m a.m.s.l)
"Upper Red Line"
"Lower Red Line"
"Black Line"
Fig. 13.5 Lake Tiberias lake levels (Source: Markel et al. 2014 )
13 Water Resources, Cooperation and Power Asymmetries in the Water Management…