

by the full insertion of C1, C2, and C3 rods. The numerical calculation was
performed by MCNPX based on ENDF/B-VII.0. The generation of the spallation
neutrons was included in the MCNPX calculation bombarding the tungsten target
with 100 MeV proton beams. Because the reactivity effect of the In wire is
considered to be not negligible, the In wire was taken into account in the simulated
calculation: the reaction rates were deduced from tallies taken in the In wire setting
region. The result of the fixed source calculation for the reaction rates was obtained
after 2,000 active cycles of 100,000 histories, which led to a statistical error less
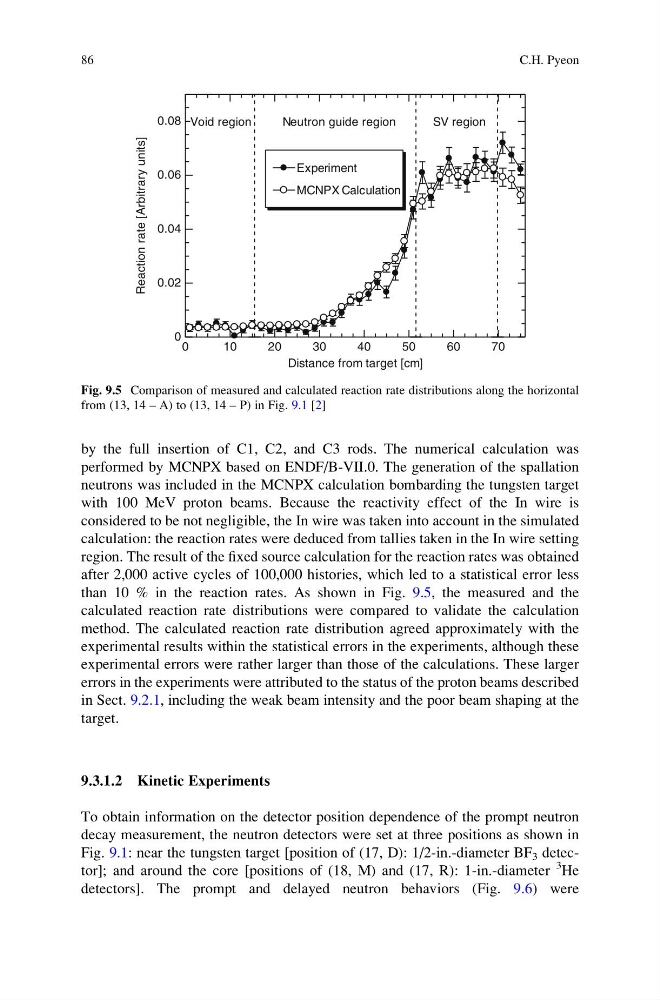
than 10 % in the reaction rates. As shown in Fig. 9.5, the measured and the
calculated reaction rate distributions were compared to validate the calculation
method. The calculated reaction rate distribution agreed approximately with the
experimental results within the statistical errors in the experiments, although these
experimental errors were rather larger than those of the calculations. These larger
errors in the experiments were attributed to the status of the proton beams described
in Sect. 9.2.1, including the weak beam intensity and the poor beam shaping at the
target.
9.3.1.2 Kinetic Experiments
To obtain information on the detector position dependence of the prompt neutron
decay measurement, the neutron detectors were set at three positions as shown in
Fig. 9.1: near the tungsten target [position of (17, D): 1/2-in.-diameter BF 3 detector]; and around the core [positions of (18, M) and (17, R): 1-in.-diameter
3 He
detectors]. The prompt and delayed neutron behaviors (Fig. 9.6) were
0
10
20
30
40
50
60
70
0
0.02
0.04
0.06
0.08
Distance from target [cm]
Reaction rate [Arbitrary units]
Neutron guide region
SV region
Void region
Experiment
MCNPX Calculation
Fig. 9.5 Comparison of measured and calculated reaction rate distributions along the horizontal
from (13, 14 – A) to (13, 14 – P) in Fig. 9.1 [2]
86
C.H. Pyeon
performed by MCNPX based on ENDF/B-VII.0. The generation of the spallation
neutrons was included in the MCNPX calculation bombarding the tungsten target
with 100 MeV proton beams. Because the reactivity effect of the In wire is
considered to be not negligible, the In wire was taken into account in the simulated
calculation: the reaction rates were deduced from tallies taken in the In wire setting
region. The result of the fixed source calculation for the reaction rates was obtained
after 2,000 active cycles of 100,000 histories, which led to a statistical error less
than 10 % in the reaction rates. As shown in Fig. 9.5, the measured and the
calculated reaction rate distributions were compared to validate the calculation
method. The calculated reaction rate distribution agreed approximately with the
experimental results within the statistical errors in the experiments, although these
experimental errors were rather larger than those of the calculations. These larger
errors in the experiments were attributed to the status of the proton beams described
in Sect. 9.2.1, including the weak beam intensity and the poor beam shaping at the
target.
9.3.1.2 Kinetic Experiments
To obtain information on the detector position dependence of the prompt neutron
decay measurement, the neutron detectors were set at three positions as shown in
Fig. 9.1: near the tungsten target [position of (17, D): 1/2-in.-diameter BF 3 detector]; and around the core [positions of (18, M) and (17, R): 1-in.-diameter
3 He
detectors]. The prompt and delayed neutron behaviors (Fig. 9.6) were
0
10
20
30
40
50
60
70
0
0.02
0.04
0.06
0.08
Distance from target [cm]
Reaction rate [Arbitrary units]
Neutron guide region
SV region
Void region
Experiment
MCNPX Calculation
Fig. 9.5 Comparison of measured and calculated reaction rate distributions along the horizontal
from (13, 14 – A) to (13, 14 – P) in Fig. 9.1 [2]
86
C.H. Pyeon