

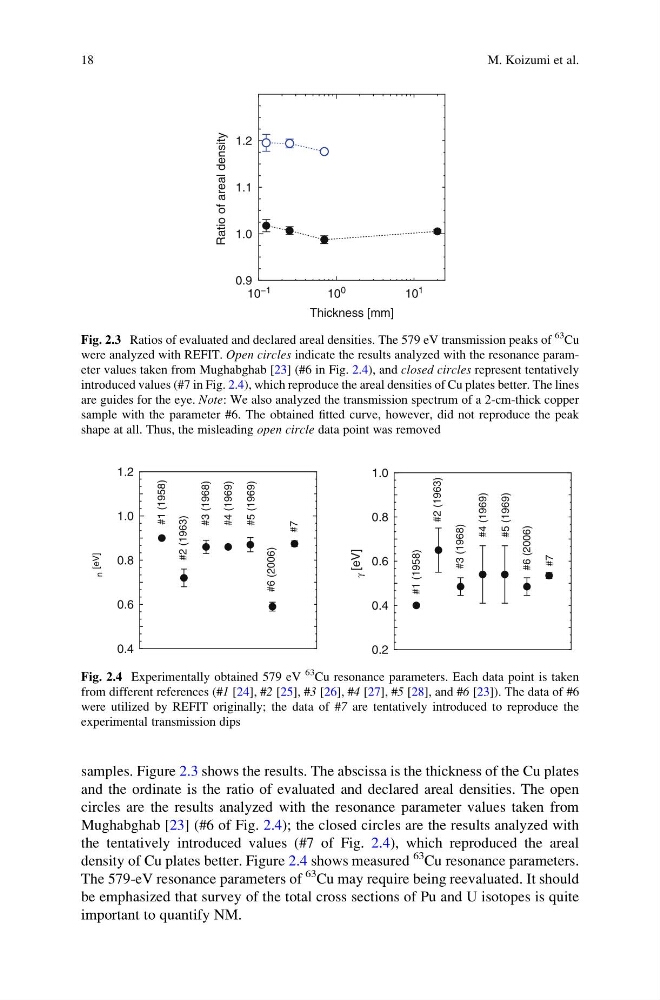
samples. Figure 2.3 shows the results. The abscissa is the thickness of the Cu plates
and the ordinate is the ratio of evaluated and declared areal densities. The open
circles are the results analyzed with the resonance parameter values taken from
Mughabghab [23] (#6 of Fig. 2.4); the closed circles are the results analyzed with
the tentatively introduced values (#7 of Fig. 2.4), which reproduced the areal
density of Cu plates better. Figure 2.4 shows measured
63 Cu resonance parameters.
The 579-eV resonance parameters of
63 Cu may require being reevaluated. It should
be emphasized that survey of the total cross sections of Pu and U isotopes is quite
important to quantify NM.
10 −1
10 0
10 1
0.9
1.0
1.1
1.2
Ratio of areal density
Thickness [mm]
Fig. 2.3 Ratios of evaluated and declared areal densities. The 579 eV transmission peaks of
63
Cu
were analyzed with REFIT. Open circles indicate the results analyzed with the resonance parameter values taken from Mughabghab [23] (#6 in Fig. 2.4), and closed circles represent tentatively
introduced values (#7 in Fig. 2.4), which reproduce the areal densities of Cu plates better. The lines
are guides for the eye. Note: We also analyzed the transmission spectrum of a 2-cm-thick copper
sample with the parameter #6. The obtained fitted curve, however, did not reproduce the peak
shape at all. Thus, the misleading open circle data point was removed
0.4
0.6
0.8
1.0
1.2
n [eV]
#4 (1969)
#3 (1968)
#2 (1963)
#5 (1969)
#1 (1958)
#6 (2006)
#7
0.2
0.4
0.6
0.8
1.0
γ [eV]
#4 (1969)
#3 (1968)
#2 (1963)
#5 (1969)
#1 (1958)
#6 (2006)
#7
Fig. 2.4 Experimentally obtained 579 eV
63
Cu resonance parameters. Each data point is taken
from different references (#1 [24], #2 [25], #3 [26], #4 [27], #5 [28], and #6 [23]). The data of #6
were utilized by REFIT originally; the data of #7 are tentatively introduced to reproduce the
experimental transmission dips
18
M. Koizumi et al.
and the ordinate is the ratio of evaluated and declared areal densities. The open
circles are the results analyzed with the resonance parameter values taken from
Mughabghab [23] (#6 of Fig. 2.4); the closed circles are the results analyzed with
the tentatively introduced values (#7 of Fig. 2.4), which reproduced the areal
density of Cu plates better. Figure 2.4 shows measured
63 Cu resonance parameters.
The 579-eV resonance parameters of
63 Cu may require being reevaluated. It should
be emphasized that survey of the total cross sections of Pu and U isotopes is quite
important to quantify NM.
10 −1
10 0
10 1
0.9
1.0
1.1
1.2
Ratio of areal density
Thickness [mm]
Fig. 2.3 Ratios of evaluated and declared areal densities. The 579 eV transmission peaks of
63
Cu
were analyzed with REFIT. Open circles indicate the results analyzed with the resonance parameter values taken from Mughabghab [23] (#6 in Fig. 2.4), and closed circles represent tentatively
introduced values (#7 in Fig. 2.4), which reproduce the areal densities of Cu plates better. The lines
are guides for the eye. Note: We also analyzed the transmission spectrum of a 2-cm-thick copper
sample with the parameter #6. The obtained fitted curve, however, did not reproduce the peak
shape at all. Thus, the misleading open circle data point was removed
0.4
0.6
0.8
1.0
1.2
n [eV]
#4 (1969)
#3 (1968)
#2 (1963)
#5 (1969)
#1 (1958)
#6 (2006)
#7
0.2
0.4
0.6
0.8
1.0
γ [eV]
#4 (1969)
#3 (1968)
#2 (1963)
#5 (1969)
#1 (1958)
#6 (2006)
#7
Fig. 2.4 Experimentally obtained 579 eV
63
Cu resonance parameters. Each data point is taken
from different references (#1 [24], #2 [25], #3 [26], #4 [27], #5 [28], and #6 [23]). The data of #6
were utilized by REFIT originally; the data of #7 are tentatively introduced to reproduce the
experimental transmission dips
18
M. Koizumi et al.