

Except for the initial composition, the analysis conditions described in
Sect. 20.3.1 were assumed. The composition data reported by the Atomic Energy
Society of Japan [6] were applied in this analysis. In this reference, the concentration distributions of some elements with their mean values and standard deviations
have been determined based on several measured data. The initial composition
based on measured data is shown in Table 20.9 together with that based on the
standard specification.
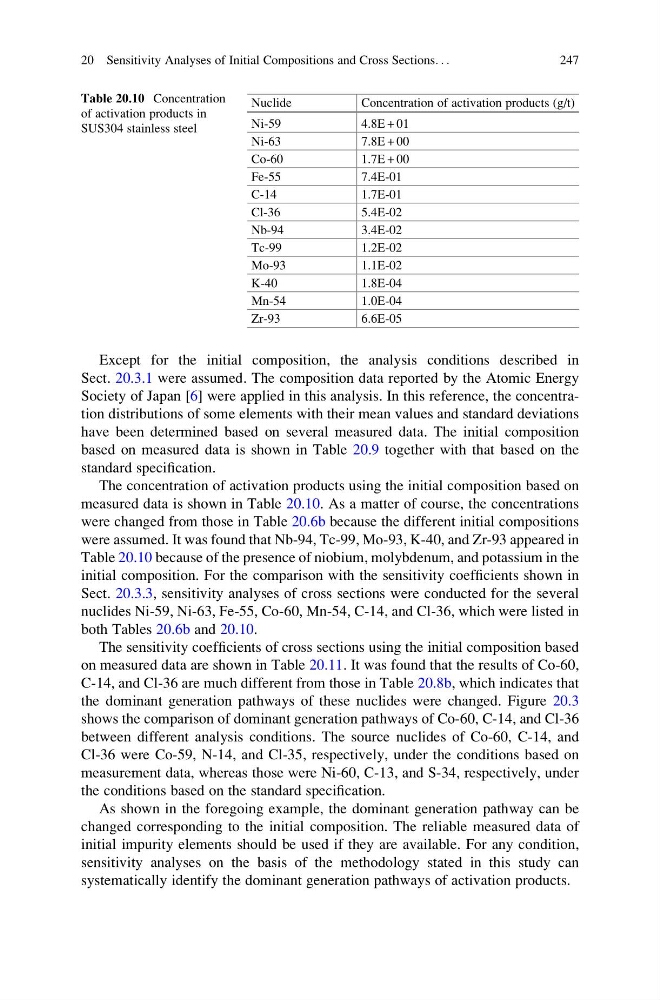
The concentration of activation products using the initial composition based on
measured data is shown in Table 20.10. As a matter of course, the concentrations
were changed from those in Table 20.6b because the different initial compositions
were assumed. It was found that Nb-94, Tc-99, Mo-93, K-40, and Zr-93 appeared in
Table 20.10 because of the presence of niobium, molybdenum, and potassium in the
initial composition. For the comparison with the sensitivity coefficients shown in
Sect. 20.3.3, sensitivity analyses of cross sections were conducted for the several
nuclides Ni-59, Ni-63, Fe-55, Co-60, Mn-54, C-14, and Cl-36, which were listed in
both Tables 20.6b and 20.10.
The sensitivity coefficients of cross sections using the initial composition based
on measured data are shown in Table 20.11. It was found that the results of Co-60,
C-14, and Cl-36 are much different from those in Table 20.8b, which indicates that
the dominant generation pathways of these nuclides were changed. Figure 20.3
shows the comparison of dominant generation pathways of Co-60, C-14, and Cl-36
between different analysis conditions. The source nuclides of Co-60, C-14, and
Cl-36 were Co-59, N-14, and Cl-35, respectively, under the conditions based on
measurement data, whereas those were Ni-60, C-13, and S-34, respectively, under
the conditions based on the standard specification.
As shown in the foregoing example, the dominant generation pathway can be
changed corresponding to the initial composition. The reliable measured data of
initial impurity elements should be used if they are available. For any condition,
sensitivity analyses on the basis of the methodology stated in this study can
systematically identify the dominant generation pathways of activation products.
Table 20.10 Concentration
of activation products in
SUS304 stainless steel
Nuclide
Concentration of activation products (g/t)
Ni-59
4.8E + 01
Ni-63
7.8E + 00
Co-60
1.7E + 00
Fe-55
7.4E-01
C-14
1.7E-01
Cl-36
5.4E-02
Nb-94
3.4E-02
Tc-99
1.2E-02
Mo-93
1.1E-02
K-40
1.8E-04
Mn-54
1.0E-04
Zr-93
6.6E-05
20 Sensitivity Analyses of Initial Compositions and Cross Sections. . .
247
Sect. 20.3.1 were assumed. The composition data reported by the Atomic Energy
Society of Japan [6] were applied in this analysis. In this reference, the concentration distributions of some elements with their mean values and standard deviations
have been determined based on several measured data. The initial composition
based on measured data is shown in Table 20.9 together with that based on the
standard specification.
The concentration of activation products using the initial composition based on
measured data is shown in Table 20.10. As a matter of course, the concentrations
were changed from those in Table 20.6b because the different initial compositions
were assumed. It was found that Nb-94, Tc-99, Mo-93, K-40, and Zr-93 appeared in
Table 20.10 because of the presence of niobium, molybdenum, and potassium in the
initial composition. For the comparison with the sensitivity coefficients shown in
Sect. 20.3.3, sensitivity analyses of cross sections were conducted for the several
nuclides Ni-59, Ni-63, Fe-55, Co-60, Mn-54, C-14, and Cl-36, which were listed in
both Tables 20.6b and 20.10.
The sensitivity coefficients of cross sections using the initial composition based
on measured data are shown in Table 20.11. It was found that the results of Co-60,
C-14, and Cl-36 are much different from those in Table 20.8b, which indicates that
the dominant generation pathways of these nuclides were changed. Figure 20.3
shows the comparison of dominant generation pathways of Co-60, C-14, and Cl-36
between different analysis conditions. The source nuclides of Co-60, C-14, and
Cl-36 were Co-59, N-14, and Cl-35, respectively, under the conditions based on
measurement data, whereas those were Ni-60, C-13, and S-34, respectively, under
the conditions based on the standard specification.
As shown in the foregoing example, the dominant generation pathway can be
changed corresponding to the initial composition. The reliable measured data of
initial impurity elements should be used if they are available. For any condition,
sensitivity analyses on the basis of the methodology stated in this study can
systematically identify the dominant generation pathways of activation products.
Table 20.10 Concentration
of activation products in
SUS304 stainless steel
Nuclide
Concentration of activation products (g/t)
Ni-59
4.8E + 01
Ni-63
7.8E + 00
Co-60
1.7E + 00
Fe-55
7.4E-01
C-14
1.7E-01
Cl-36
5.4E-02
Nb-94
3.4E-02
Tc-99
1.2E-02
Mo-93
1.1E-02
K-40
1.8E-04
Mn-54
1.0E-04
Zr-93
6.6E-05
20 Sensitivity Analyses of Initial Compositions and Cross Sections. . .
247