

magnitude of neutron flux decreases with elapsed time (Fig. 13.8). The neutron
spectrum is compared between two modes, where the shape of the spectrum in timedependent mode is almost stable (at 1e
À3 s). The comparison of the neutron
spectrum is shown in Fig. 13.9. The neutron spectrum in time-dependent mode
depends on the subcriticality of the system, and the spectrum becomes soft as the
subcriticality becomes deep. This tendency can be understood by considering the
following facts. The magnitude of neutron flux decreases as a function of elapsed
time in the subcritical system, and the decreasing speed of neutron flux becomes
1E-2
1E-1
1E+0
1E+1
1E+2
1E+3
1E+4
1E+5
0
1 0
2 0
3 0
4 0
5 0
6 0
7 0
Neutron flux [arb. unit]
Distance from T-target [cm]
1e-6 [sec]
1e-5 [sec]
1e-4 [sec]
1e-3 [sec]
2e-3 [sec]
3e-3 [sec]
Fuel Region
Reflector Region
Reflector Region
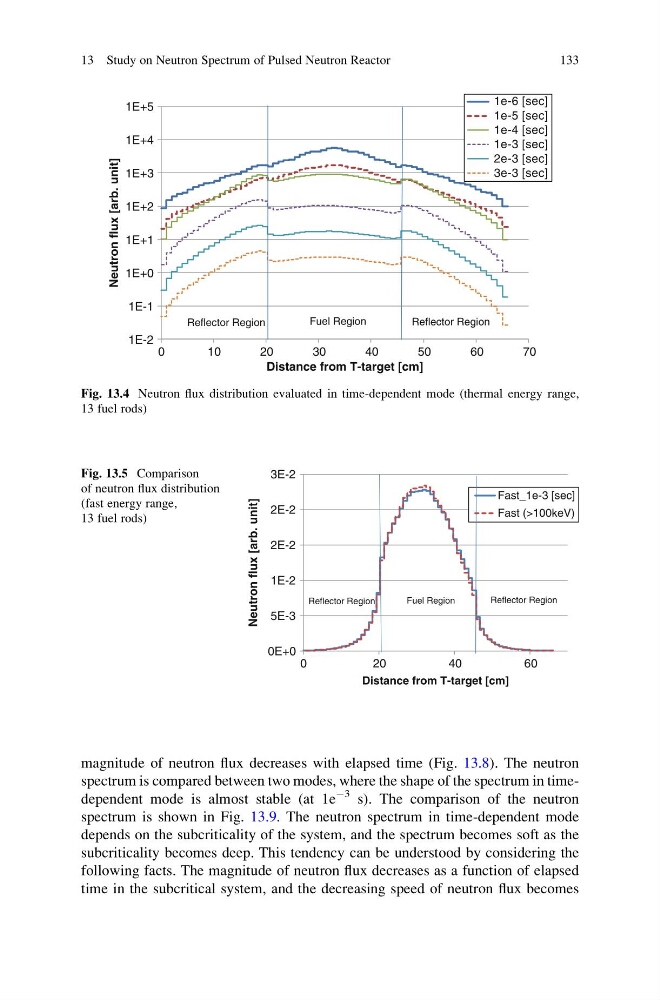
Fig. 13.4 Neutron flux distribution evaluated in time-dependent mode (thermal energy range,
13 fuel rods)
0E+0
5E-3
1E-2
2E-2
2E-2
3E-2
0
2 0
4 0
6 0
Neutron flux [arb. unit]
Distance from T-target [cm]
Fast_1e-3 [sec]
Fast (>100keV)
Fuel Region
Reflector Region
Reflector Region
Fig. 13.5 Comparison
of neutron flux distribution
(fast energy range,
13 fuel rods)
13 Study on Neutron Spectrum of Pulsed Neutron Reactor
133
spectrum is compared between two modes, where the shape of the spectrum in timedependent mode is almost stable (at 1e
À3 s). The comparison of the neutron
spectrum is shown in Fig. 13.9. The neutron spectrum in time-dependent mode
depends on the subcriticality of the system, and the spectrum becomes soft as the
subcriticality becomes deep. This tendency can be understood by considering the
following facts. The magnitude of neutron flux decreases as a function of elapsed
time in the subcritical system, and the decreasing speed of neutron flux becomes
1E-2
1E-1
1E+0
1E+1
1E+2
1E+3
1E+4
1E+5
0
1 0
2 0
3 0
4 0
5 0
6 0
7 0
Neutron flux [arb. unit]
Distance from T-target [cm]
1e-6 [sec]
1e-5 [sec]
1e-4 [sec]
1e-3 [sec]
2e-3 [sec]
3e-3 [sec]
Fuel Region
Reflector Region
Reflector Region
Fig. 13.4 Neutron flux distribution evaluated in time-dependent mode (thermal energy range,
13 fuel rods)
0E+0
5E-3
1E-2
2E-2
2E-2
3E-2
0
2 0
4 0
6 0
Neutron flux [arb. unit]
Distance from T-target [cm]
Fast_1e-3 [sec]
Fast (>100keV)
Fuel Region
Reflector Region
Reflector Region
Fig. 13.5 Comparison
of neutron flux distribution
(fast energy range,
13 fuel rods)
13 Study on Neutron Spectrum of Pulsed Neutron Reactor
133