

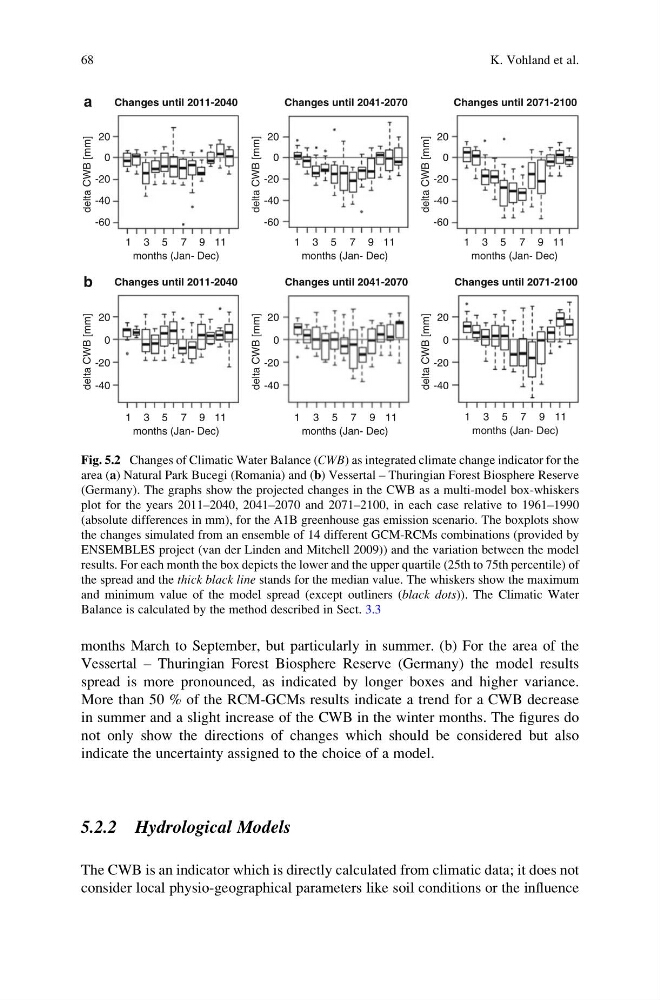
months March to September, but particularly in summer. (b) For the area of the
Vessertal – Thuringian Forest Biosphere Reserve (Germany) the model results
spread is more pronounced, as indicated by longer boxes and higher variance.
More than 50 % of the RCM-GCMs results indicate a trend for a CWB decrease
in summer and a slight increase of the CWB in the winter months. The figures do
not only show the directions of changes which should be considered but also
indicate the uncertainty assigned to the choice of a model.
5.2.2 Hydrological Models
The CWB is an indicator which is directly calculated from climatic data; it does not
consider local physio-geographical parameters like soil conditions or the influence
1 3 5 7 9 11
-60
-40
-20
0
20
Changes until 2011-2040
a
b
months (Jan- Dec)
1 3 5 7 9 11
months (Jan- Dec)
delta CWB [mm]
-40
-20
0
20
delta CWB [mm]
1 3 5 7 9 11
months (Jan- Dec)
-40
-20
0
20
delta CWB [mm]
1 3 5 7 9 11
months (Jan- Dec)
-40
-20
0
20
delta CWB [mm]
1 3 5 7 9 11
-60
-40
-20
0
20
months (Jan- Dec)
delta CWB [mm]
1 3 5 7 9 11
-60
-40
-20
0
20
months (Jan- Dec)
delta CWB [mm]
Changes until 2041-2070
Changes until 2071-2100
Changes until 2011-2040
Changes until 2041-2070
Changes until 2071-2100
Fig. 5.2 Changes of Climatic Water Balance (CWB) as integrated climate change indicator for the
area (a) Natural Park Bucegi (Romania) and (b) Vessertal – Thuringian Forest Biosphere Reserve
(Germany). The graphs show the projected changes in the CWB as a multi-model box-whiskers
plot for the years 2011–2040, 2041–2070 and 2071–2100, in each case relative to 1961–1990
(absolute differences in mm), for the A1B greenhouse gas emission scenario. The boxplots show
the changes simulated from an ensemble of 14 different GCM-RCMs combinations (provided by
ENSEMBLES project (van der Linden and Mitchell 2009)) and the variation between the model
results. For each month the box depicts the lower and the upper quartile (25th to 75th percentile) of
the spread and the thick black line stands for the median value. The whiskers show the maximum
and minimum value of the model spread (except outliners (black dots)). The Climatic Water
Balance is calculated by the method described in Sect. 3.3
68
K. Vohland et al.
Vessertal – Thuringian Forest Biosphere Reserve (Germany) the model results
spread is more pronounced, as indicated by longer boxes and higher variance.
More than 50 % of the RCM-GCMs results indicate a trend for a CWB decrease
in summer and a slight increase of the CWB in the winter months. The figures do
not only show the directions of changes which should be considered but also
indicate the uncertainty assigned to the choice of a model.
5.2.2 Hydrological Models
The CWB is an indicator which is directly calculated from climatic data; it does not
consider local physio-geographical parameters like soil conditions or the influence
1 3 5 7 9 11
-60
-40
-20
0
20
Changes until 2011-2040
a
b
months (Jan- Dec)
1 3 5 7 9 11
months (Jan- Dec)
delta CWB [mm]
-40
-20
0
20
delta CWB [mm]
1 3 5 7 9 11
months (Jan- Dec)
-40
-20
0
20
delta CWB [mm]
1 3 5 7 9 11
months (Jan- Dec)
-40
-20
0
20
delta CWB [mm]
1 3 5 7 9 11
-60
-40
-20
0
20
months (Jan- Dec)
delta CWB [mm]
1 3 5 7 9 11
-60
-40
-20
0
20
months (Jan- Dec)
delta CWB [mm]
Changes until 2041-2070
Changes until 2071-2100
Changes until 2011-2040
Changes until 2041-2070
Changes until 2071-2100
Fig. 5.2 Changes of Climatic Water Balance (CWB) as integrated climate change indicator for the
area (a) Natural Park Bucegi (Romania) and (b) Vessertal – Thuringian Forest Biosphere Reserve
(Germany). The graphs show the projected changes in the CWB as a multi-model box-whiskers
plot for the years 2011–2040, 2041–2070 and 2071–2100, in each case relative to 1961–1990
(absolute differences in mm), for the A1B greenhouse gas emission scenario. The boxplots show
the changes simulated from an ensemble of 14 different GCM-RCMs combinations (provided by
ENSEMBLES project (van der Linden and Mitchell 2009)) and the variation between the model
results. For each month the box depicts the lower and the upper quartile (25th to 75th percentile) of
the spread and the thick black line stands for the median value. The whiskers show the maximum
and minimum value of the model spread (except outliners (black dots)). The Climatic Water
Balance is calculated by the method described in Sect. 3.3
68
K. Vohland et al.