

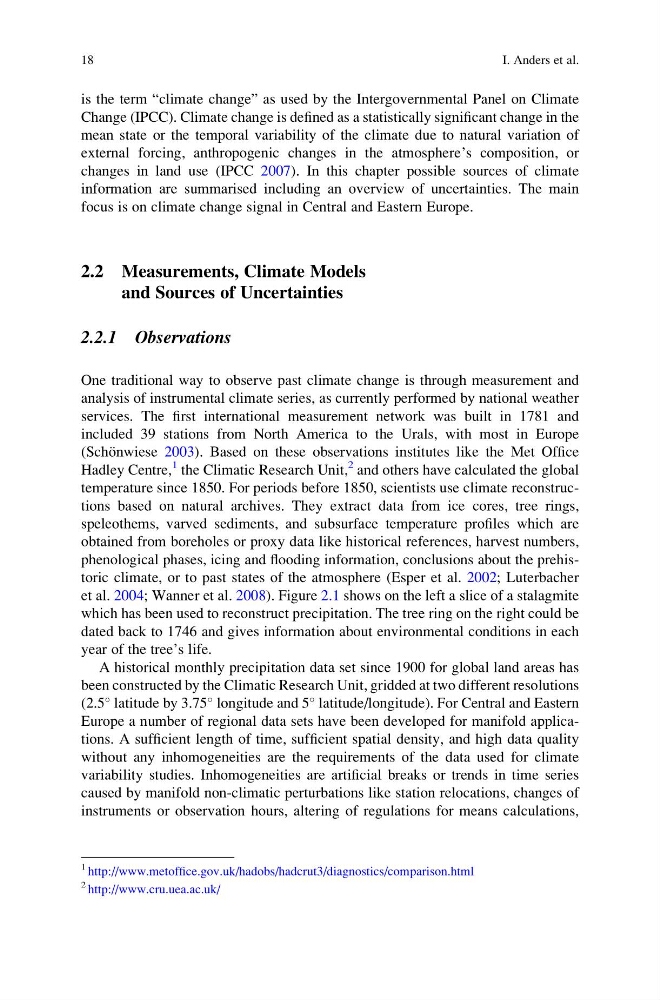
is the term “climate change” as used by the Intergovernmental Panel on Climate
Change (IPCC). Climate change is defined as a statistically significant change in the
mean state or the temporal variability of the climate due to natural variation of
external forcing, anthropogenic changes in the atmosphere’s composition, or
changes in land use (IPCC 2007). In this chapter possible sources of climate
information are summarised including an overview of uncertainties. The main
focus is on climate change signal in Central and Eastern Europe.
2.2 Measurements, Climate Models
and Sources of Uncertainties
2.2.1 Observations
One traditional way to observe past climate change is through measurement and
analysis of instrumental climate series, as currently performed by national weather
services. The first international measurement network was built in 1781 and
included 39 stations from North America to the Urals, with most in Europe
(Scho ¨nwiese 2003). Based on these observations institutes like the Met Office
Hadley Centre,
1 the Climatic Research Unit,
2 and others have calculated the global
temperature since 1850. For periods before 1850, scientists use climate reconstructions based on natural archives. They extract data from ice cores, tree rings,
speleothems, varved sediments, and subsurface temperature profiles which are
obtained from boreholes or proxy data like historical references, harvest numbers,
phenological phases, icing and flooding information, conclusions about the prehistoric climate, or to past states of the atmosphere (Esper et al. 2002; Luterbacher
et al. 2004; Wanner et al. 2008). Figure 2.1 shows on the left a slice of a stalagmite
which has been used to reconstruct precipitation. The tree ring on the right could be
dated back to 1746 and gives information about environmental conditions in each
year of the tree’s life.
A historical monthly precipitation data set since 1900 for global land areas has
been constructed by the Climatic Research Unit, gridded at two different resolutions
(2.5
latitude by 3.75
longitude and 5
latitude/longitude). For Central and Eastern
Europe a number of regional data sets have been developed for manifold applications. A sufficient length of time, sufficient spatial density, and high data quality
without any inhomogeneities are the requirements of the data used for climate
variability studies. Inhomogeneities are artificial breaks or trends in time series
caused by manifold non-climatic perturbations like station relocations, changes of
instruments or observation hours, altering of regulations for means calculations,
1 http://www.metoffice.gov.uk/hadobs/hadcrut3/diagnostics/comparison.html
2 http://www.cru.uea.ac.uk/
18
I. Anders et al.
Change (IPCC). Climate change is defined as a statistically significant change in the
mean state or the temporal variability of the climate due to natural variation of
external forcing, anthropogenic changes in the atmosphere’s composition, or
changes in land use (IPCC 2007). In this chapter possible sources of climate
information are summarised including an overview of uncertainties. The main
focus is on climate change signal in Central and Eastern Europe.
2.2 Measurements, Climate Models
and Sources of Uncertainties
2.2.1 Observations
One traditional way to observe past climate change is through measurement and
analysis of instrumental climate series, as currently performed by national weather
services. The first international measurement network was built in 1781 and
included 39 stations from North America to the Urals, with most in Europe
(Scho ¨nwiese 2003). Based on these observations institutes like the Met Office
Hadley Centre,
1 the Climatic Research Unit,
2 and others have calculated the global
temperature since 1850. For periods before 1850, scientists use climate reconstructions based on natural archives. They extract data from ice cores, tree rings,
speleothems, varved sediments, and subsurface temperature profiles which are
obtained from boreholes or proxy data like historical references, harvest numbers,
phenological phases, icing and flooding information, conclusions about the prehistoric climate, or to past states of the atmosphere (Esper et al. 2002; Luterbacher
et al. 2004; Wanner et al. 2008). Figure 2.1 shows on the left a slice of a stalagmite
which has been used to reconstruct precipitation. The tree ring on the right could be
dated back to 1746 and gives information about environmental conditions in each
year of the tree’s life.
A historical monthly precipitation data set since 1900 for global land areas has
been constructed by the Climatic Research Unit, gridded at two different resolutions
(2.5
latitude by 3.75
longitude and 5
latitude/longitude). For Central and Eastern
Europe a number of regional data sets have been developed for manifold applications. A sufficient length of time, sufficient spatial density, and high data quality
without any inhomogeneities are the requirements of the data used for climate
variability studies. Inhomogeneities are artificial breaks or trends in time series
caused by manifold non-climatic perturbations like station relocations, changes of
instruments or observation hours, altering of regulations for means calculations,
1 http://www.metoffice.gov.uk/hadobs/hadcrut3/diagnostics/comparison.html
2 http://www.cru.uea.ac.uk/
18
I. Anders et al.