

Australia (Elumpe Akumu et al. 2011) demonstrated that a metre rise in sea
level could decrease inland fresh marshes from 225.67 to 168.04 km
2 by the end
of the century.
In that light we wanted to address the following research questions in the present
study: (1) Is sea level rise a serious threat for coastal wetlands on the sedimentary
coast of the Northern Adriatic – what are the trends of sea level rise in the nearest
measuring point to the two coastal protected areas with Natura 2000 (N2000)
habitat types? (2) Do the present spatial distribution of coastal habitat types
(a habitat map) match with micro-elevations (digital elevation model)? To which
extend? (3) Is it possible to develop a relevant habitat transition model using
different scenarios of sea level rise? (4) Which mitigation measures are feasible?
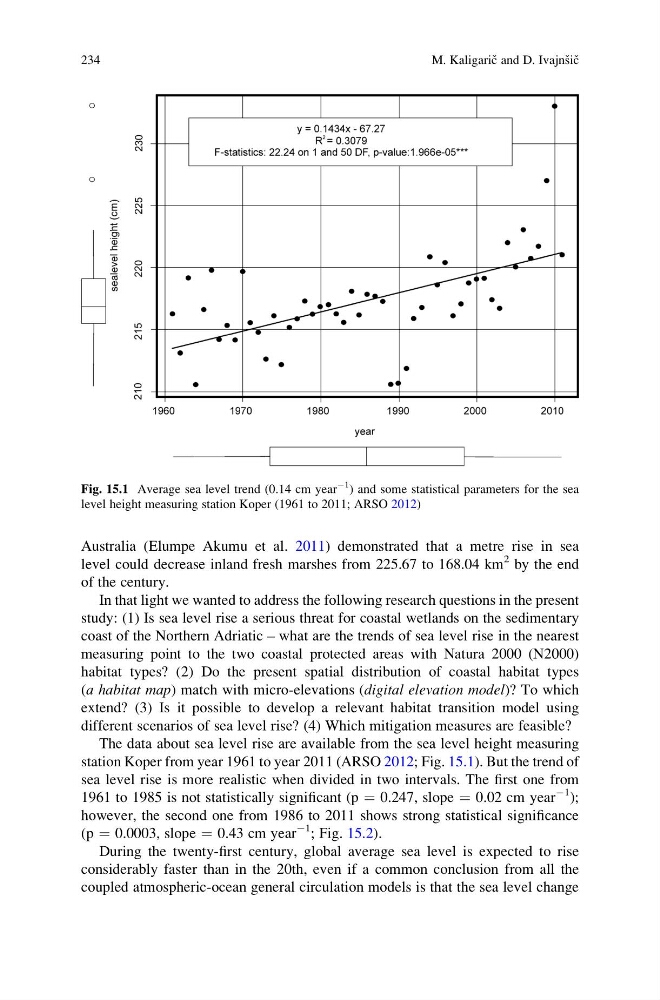
The data about sea level rise are available from the sea level height measuring
station Koper from year 1961 to year 2011 (ARSO 2012; Fig. 15.1). But the trend of
sea level rise is more realistic when divided in two intervals. The first one from
1961 to 1985 is not statistically significant (p ¼ 0.247, slope ¼ 0.02 cm year
À1 );
however, the second one from 1986 to 2011 shows strong statistical significance
(p ¼ 0.0003, slope ¼ 0.43 cm year
À1 ; Fig. 15.2).
During the twenty-first century, global average sea level is expected to rise
considerably faster than in the 20th, even if a common conclusion from all the
coupled atmospheric-ocean general circulation models is that the sea level change
Fig. 15.1 Average sea level trend (0.14 cm year
À1
) and some statistical parameters for the sea
level height measuring station Koper (1961 to 2011; ARSO 2012)
234
M. Kaligaric ˇ and D. Ivajns ˇic ˇ
level could decrease inland fresh marshes from 225.67 to 168.04 km
2 by the end
of the century.
In that light we wanted to address the following research questions in the present
study: (1) Is sea level rise a serious threat for coastal wetlands on the sedimentary
coast of the Northern Adriatic – what are the trends of sea level rise in the nearest
measuring point to the two coastal protected areas with Natura 2000 (N2000)
habitat types? (2) Do the present spatial distribution of coastal habitat types
(a habitat map) match with micro-elevations (digital elevation model)? To which
extend? (3) Is it possible to develop a relevant habitat transition model using
different scenarios of sea level rise? (4) Which mitigation measures are feasible?
The data about sea level rise are available from the sea level height measuring
station Koper from year 1961 to year 2011 (ARSO 2012; Fig. 15.1). But the trend of
sea level rise is more realistic when divided in two intervals. The first one from
1961 to 1985 is not statistically significant (p ¼ 0.247, slope ¼ 0.02 cm year
À1 );
however, the second one from 1986 to 2011 shows strong statistical significance
(p ¼ 0.0003, slope ¼ 0.43 cm year
À1 ; Fig. 15.2).
During the twenty-first century, global average sea level is expected to rise
considerably faster than in the 20th, even if a common conclusion from all the
coupled atmospheric-ocean general circulation models is that the sea level change
Fig. 15.1 Average sea level trend (0.14 cm year
À1
) and some statistical parameters for the sea
level height measuring station Koper (1961 to 2011; ARSO 2012)
234
M. Kaligaric ˇ and D. Ivajns ˇic ˇ