

considered in prospective climate change analysis, potential future changes of P and T
in particular months in time horizon 2070–2100 varied in the range 17–57 mm in the
case of the average monthly sum of precipitation, and from 1.2 up to 5.8
C in the case
of the average monthly air temperature. Lower and upper extreme projections derived
from the GCM-RCM’s analysed for each particular month were considered for the
purpose of this study as the boundaries of the projection’s uncertainty range
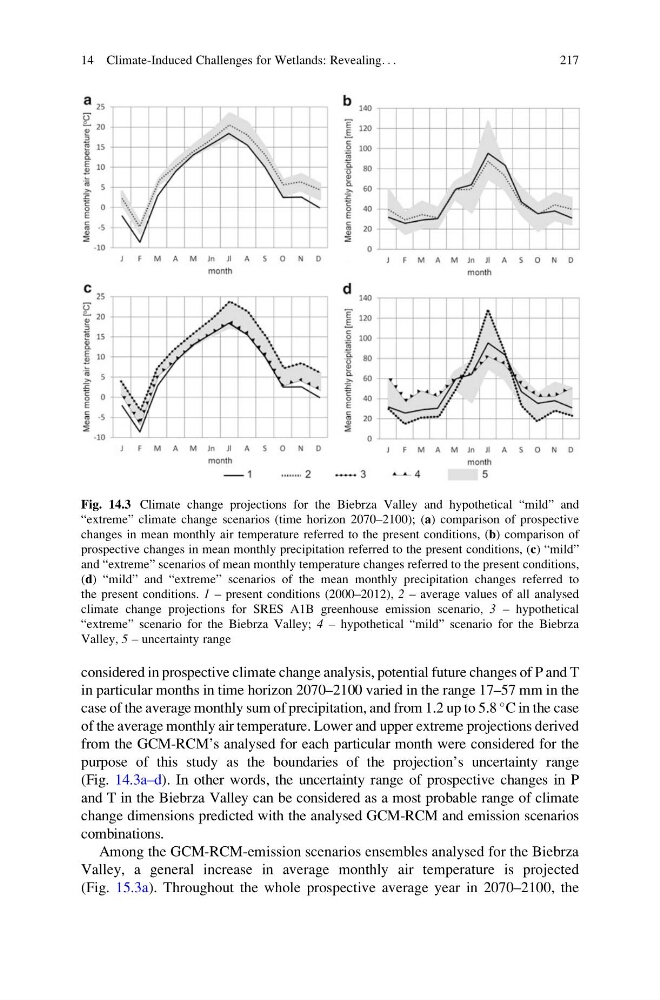
(Fig. 14.3a–d). In other words, the uncertainty range of prospective changes in P
and T in the Biebrza Valley can be considered as a most probable range of climate
change dimensions predicted with the analysed GCM-RCM and emission scenarios
combinations.
Among the GCM-RCM-emission scenarios ensembles analysed for the Biebrza
Valley, a general increase in average monthly air temperature is projected
(Fig. 15.3a). Throughout the whole prospective average year in 2070–2100, the
Fig. 14.3 Climate change projections for the Biebrza Valley and hypothetical “mild” and
“extreme” climate change scenarios (time horizon 2070–2100); (a) comparison of prospective
changes in mean monthly air temperature referred to the present conditions, (b) comparison of
prospective changes in mean monthly precipitation referred to the present conditions, (c) “mild”
and “extreme” scenarios of mean monthly temperature changes referred to the present conditions,
(d) “mild” and “extreme” scenarios of the mean monthly precipitation changes referred to
the present conditions. 1 – present conditions (2000–2012), 2 – average values of all analysed
climate change projections for SRES A1B greenhouse emission scenario, 3 – hypothetical
“extreme” scenario for the Biebrza Valley; 4 – hypothetical “mild” scenario for the Biebrza
Valley, 5 – uncertainty range
14 Climate-Induced Challenges for Wetlands: Revealing. . .
217
in particular months in time horizon 2070–2100 varied in the range 17–57 mm in the
case of the average monthly sum of precipitation, and from 1.2 up to 5.8
C in the case
of the average monthly air temperature. Lower and upper extreme projections derived
from the GCM-RCM’s analysed for each particular month were considered for the
purpose of this study as the boundaries of the projection’s uncertainty range
(Fig. 14.3a–d). In other words, the uncertainty range of prospective changes in P
and T in the Biebrza Valley can be considered as a most probable range of climate
change dimensions predicted with the analysed GCM-RCM and emission scenarios
combinations.
Among the GCM-RCM-emission scenarios ensembles analysed for the Biebrza
Valley, a general increase in average monthly air temperature is projected
(Fig. 15.3a). Throughout the whole prospective average year in 2070–2100, the
Fig. 14.3 Climate change projections for the Biebrza Valley and hypothetical “mild” and
“extreme” climate change scenarios (time horizon 2070–2100); (a) comparison of prospective
changes in mean monthly air temperature referred to the present conditions, (b) comparison of
prospective changes in mean monthly precipitation referred to the present conditions, (c) “mild”
and “extreme” scenarios of mean monthly temperature changes referred to the present conditions,
(d) “mild” and “extreme” scenarios of the mean monthly precipitation changes referred to
the present conditions. 1 – present conditions (2000–2012), 2 – average values of all analysed
climate change projections for SRES A1B greenhouse emission scenario, 3 – hypothetical
“extreme” scenario for the Biebrza Valley; 4 – hypothetical “mild” scenario for the Biebrza
Valley, 5 – uncertainty range
14 Climate-Induced Challenges for Wetlands: Revealing. . .
217