

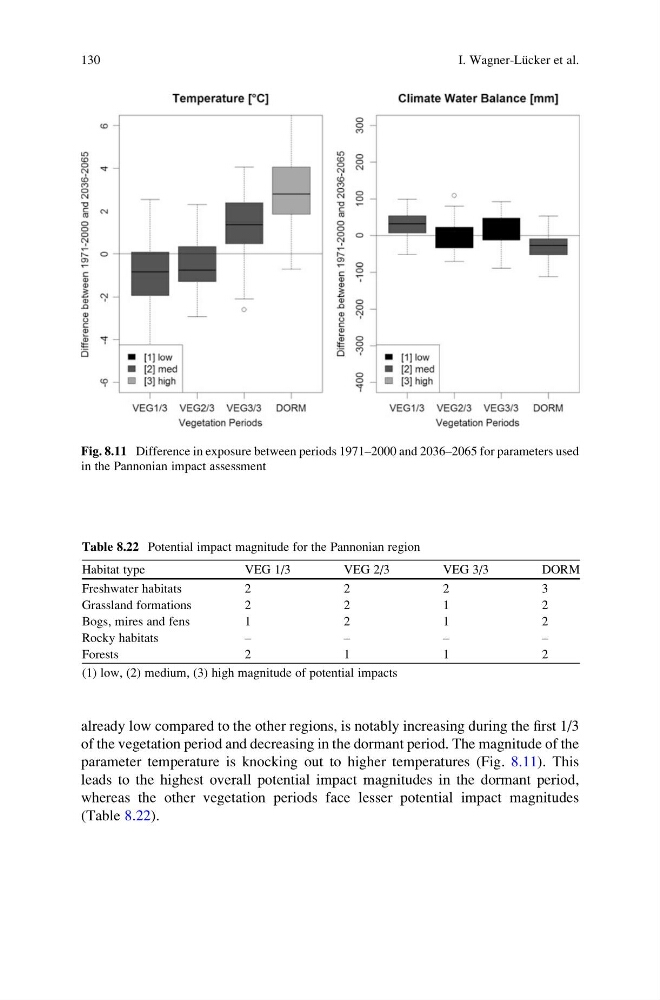
already low compared to the other regions, is notably increasing during the first 1/3
of the vegetation period and decreasing in the dormant period. The magnitude of the
parameter temperature is knocking out to higher temperatures (Fig. 8.11). This
leads to the highest overall potential impact magnitudes in the dormant period,
whereas the other vegetation periods face lesser potential impact magnitudes
(Table 8.22).
Fig. 8.11 Difference in exposure between periods 1971–2000 and 2036–2065 for parameters used
in the Pannonian impact assessment
Table 8.22 Potential impact magnitude for the Pannonian region
Habitat type
VEG 1/3
VEG 2/3
VEG 3/3
DORM
Freshwater habitats
2
2
2
3
Grassland formations
2
2
1
2
Bogs, mires and fens
1
2
1
2
Rocky habitats
–
–
–
–
Forests
2
1
1
2
(1) low, (2) medium, (3) high magnitude of potential impacts
130
I. Wagner-Lu ¨cker et al.
of the vegetation period and decreasing in the dormant period. The magnitude of the
parameter temperature is knocking out to higher temperatures (Fig. 8.11). This
leads to the highest overall potential impact magnitudes in the dormant period,
whereas the other vegetation periods face lesser potential impact magnitudes
(Table 8.22).
Fig. 8.11 Difference in exposure between periods 1971–2000 and 2036–2065 for parameters used
in the Pannonian impact assessment
Table 8.22 Potential impact magnitude for the Pannonian region
Habitat type
VEG 1/3
VEG 2/3
VEG 3/3
DORM
Freshwater habitats
2
2
2
3
Grassland formations
2
2
1
2
Bogs, mires and fens
1
2
1
2
Rocky habitats
–
–
–
–
Forests
2
1
1
2
(1) low, (2) medium, (3) high magnitude of potential impacts
130
I. Wagner-Lu ¨cker et al.