

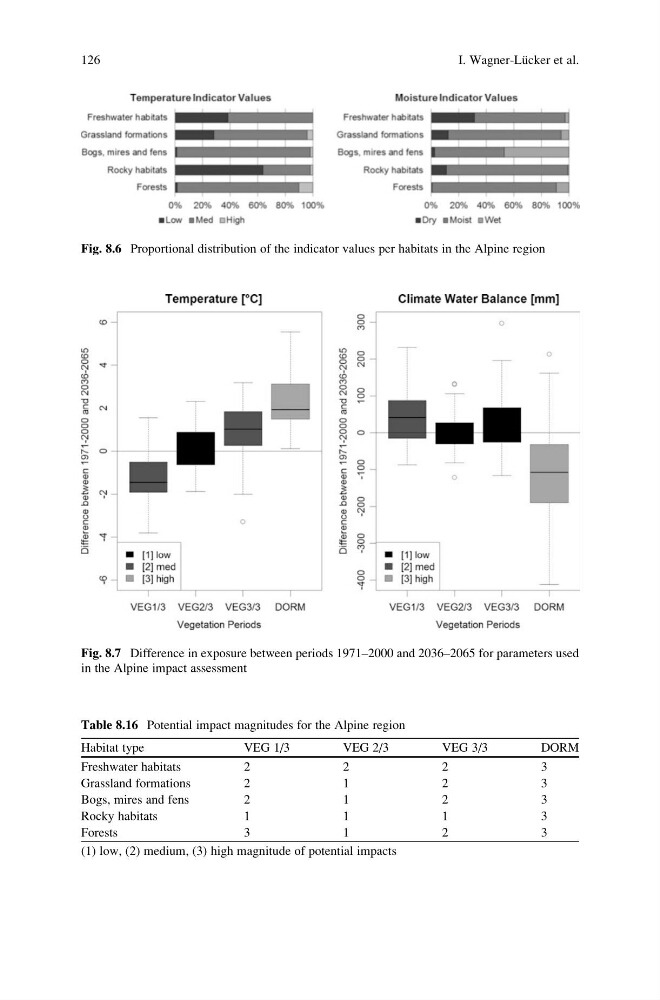
Fig. 8.6 Proportional distribution of the indicator values per habitats in the Alpine region
Fig. 8.7 Difference in exposure between periods 1971–2000 and 2036–2065 for parameters used
in the Alpine impact assessment
Table 8.16 Potential impact magnitudes for the Alpine region
Habitat type
VEG 1/3
VEG 2/3
VEG 3/3
DORM
Freshwater habitats
2
2
2
3
Grassland formations
2
1
2
3
Bogs, mires and fens
2
1
2
3
Rocky habitats
1
1
1
3
Forests
3
1
2
3
(1) low, (2) medium, (3) high magnitude of potential impacts
126
I. Wagner-Lu ¨cker et al.
Fig. 8.7 Difference in exposure between periods 1971–2000 and 2036–2065 for parameters used
in the Alpine impact assessment
Table 8.16 Potential impact magnitudes for the Alpine region
Habitat type
VEG 1/3
VEG 2/3
VEG 3/3
DORM
Freshwater habitats
2
2
2
3
Grassland formations
2
1
2
3
Bogs, mires and fens
2
1
2
3
Rocky habitats
1
1
1
3
Forests
3
1
2
3
(1) low, (2) medium, (3) high magnitude of potential impacts
126
I. Wagner-Lu ¨cker et al.