

enough had a negative sign. For the second stage of our analysis we tested whether
or not market integration contributes to greater farm efficiency and higher net
household incomes.
Because it is conceptually unclear if market integration drives farm output and
farm incomes, or vice versa, we tested the exogeneity of market integration by
including the residuals from the first stage equation as an independent variable in
two structural equations for farm output and net household income, those estimated
using OLS. The significance level of the residuals was 0.123 for the output equation
and 0.667 for the farm income equation, which suggests that endogeneity may not
have been an issue here. We nevertheless used the Two-Stage Least Squares (2SLS)
approach for the farm output equation, as the p-value was relatively low, and a
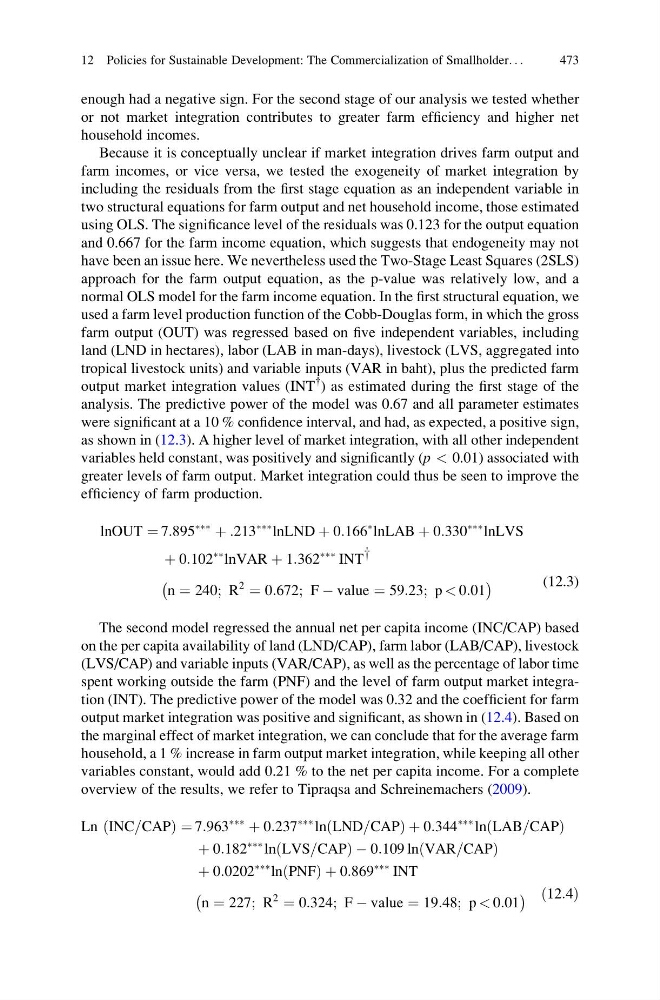
normal OLS model for the farm income equation. In the first structural equation, we
used a farm level production function of the Cobb-Douglas form, in which the gross
farm output (OUT) was regressed based on five independent variables, including
land (LND in hectares), labor (LAB in man-days), livestock (LVS, aggregated into
tropical livestock units) and variable inputs (VAR in baht), plus the predicted farm
output market integration values (INT
{ ) as estimated during the first stage of the
analysis. The predictive power of the model was 0.67 and all parameter estimates
were significant at a 10 % confidence interval, and had, as expected, a positive sign,
as shown in (12.3). A higher level of market integration, with all other independent
variables held constant, was positively and significantly (p < 0.01) associated with
greater levels of farm output. Market integration could thus be seen to improve the
efficiency of farm production.
lnOUT ¼ 7:895
ÃÃÃ
þ :213
ÃÃÃ lnLND þ 0:166
à lnLAB þ 0:330
ÃÃÃ lnLVS
þ 0:102
ÃÃ lnVAR þ 1:362
ÃÃÃ INT y
n ¼ 240; R
2
¼ 0:672; F À value ¼ 59:23; p < 0:01
À
Á
(12.3)
The second model regressed the annual net per capita income (INC/CAP) based
on the per capita availability of land (LND/CAP), farm labor (LAB/CAP), livestock
(LVS/CAP) and variable inputs (VAR/CAP), as well as the percentage of labor time
spent working outside the farm (PNF) and the level of farm output market integration (INT). The predictive power of the model was 0.32 and the coefficient for farm
output market integration was positive and significant, as shown in (12.4). Based on
the marginal effect of market integration, we can conclude that for the average farm
household, a 1 % increase in farm output market integration, while keeping all other
variables constant, would add 0.21 % to the net per capita income. For a complete
overview of the results, we refer to Tipraqsa and Schreinemachers (2009).
Ln INC=CAP
ð
Þ¼7:963
ÃÃÃ
þ 0:237
ÃÃÃ ln LND=CAP
ð
Þþ0:344
ÃÃÃ ln LAB=CAP
ð
Þ
þ 0:182
ÃÃÃ ln LVS=CAP
ð
ÞÀ0:109 ln VAR=CAP
ð
Þ
þ 0:0202
ÃÃÃ ln PNF
ð
Þþ0:869
ÃÃÃ INT
n ¼ 227; R
2
¼ 0:324; F À value ¼ 19:48; p < 0:01
À
Á ð12:4Þ
12 Policies for Sustainable Development: The Commercialization of Smallholder. . .
473
or not market integration contributes to greater farm efficiency and higher net
household incomes.
Because it is conceptually unclear if market integration drives farm output and
farm incomes, or vice versa, we tested the exogeneity of market integration by
including the residuals from the first stage equation as an independent variable in
two structural equations for farm output and net household income, those estimated
using OLS. The significance level of the residuals was 0.123 for the output equation
and 0.667 for the farm income equation, which suggests that endogeneity may not
have been an issue here. We nevertheless used the Two-Stage Least Squares (2SLS)
approach for the farm output equation, as the p-value was relatively low, and a
normal OLS model for the farm income equation. In the first structural equation, we
used a farm level production function of the Cobb-Douglas form, in which the gross
farm output (OUT) was regressed based on five independent variables, including
land (LND in hectares), labor (LAB in man-days), livestock (LVS, aggregated into
tropical livestock units) and variable inputs (VAR in baht), plus the predicted farm
output market integration values (INT
{ ) as estimated during the first stage of the
analysis. The predictive power of the model was 0.67 and all parameter estimates
were significant at a 10 % confidence interval, and had, as expected, a positive sign,
as shown in (12.3). A higher level of market integration, with all other independent
variables held constant, was positively and significantly (p < 0.01) associated with
greater levels of farm output. Market integration could thus be seen to improve the
efficiency of farm production.
lnOUT ¼ 7:895
ÃÃÃ
þ :213
ÃÃÃ lnLND þ 0:166
à lnLAB þ 0:330
ÃÃÃ lnLVS
þ 0:102
ÃÃ lnVAR þ 1:362
ÃÃÃ INT y
n ¼ 240; R
2
¼ 0:672; F À value ¼ 59:23; p < 0:01
À
Á
(12.3)
The second model regressed the annual net per capita income (INC/CAP) based
on the per capita availability of land (LND/CAP), farm labor (LAB/CAP), livestock
(LVS/CAP) and variable inputs (VAR/CAP), as well as the percentage of labor time
spent working outside the farm (PNF) and the level of farm output market integration (INT). The predictive power of the model was 0.32 and the coefficient for farm
output market integration was positive and significant, as shown in (12.4). Based on
the marginal effect of market integration, we can conclude that for the average farm
household, a 1 % increase in farm output market integration, while keeping all other
variables constant, would add 0.21 % to the net per capita income. For a complete
overview of the results, we refer to Tipraqsa and Schreinemachers (2009).
Ln INC=CAP
ð
Þ¼7:963
ÃÃÃ
þ 0:237
ÃÃÃ ln LND=CAP
ð
Þþ0:344
ÃÃÃ ln LAB=CAP
ð
Þ
þ 0:182
ÃÃÃ ln LVS=CAP
ð
ÞÀ0:109 ln VAR=CAP
ð
Þ
þ 0:0202
ÃÃÃ ln PNF
ð
Þþ0:869
ÃÃÃ INT
n ¼ 227; R
2
¼ 0:324; F À value ¼ 19:48; p < 0:01
À
Á ð12:4Þ
12 Policies for Sustainable Development: The Commercialization of Smallholder. . .
473