

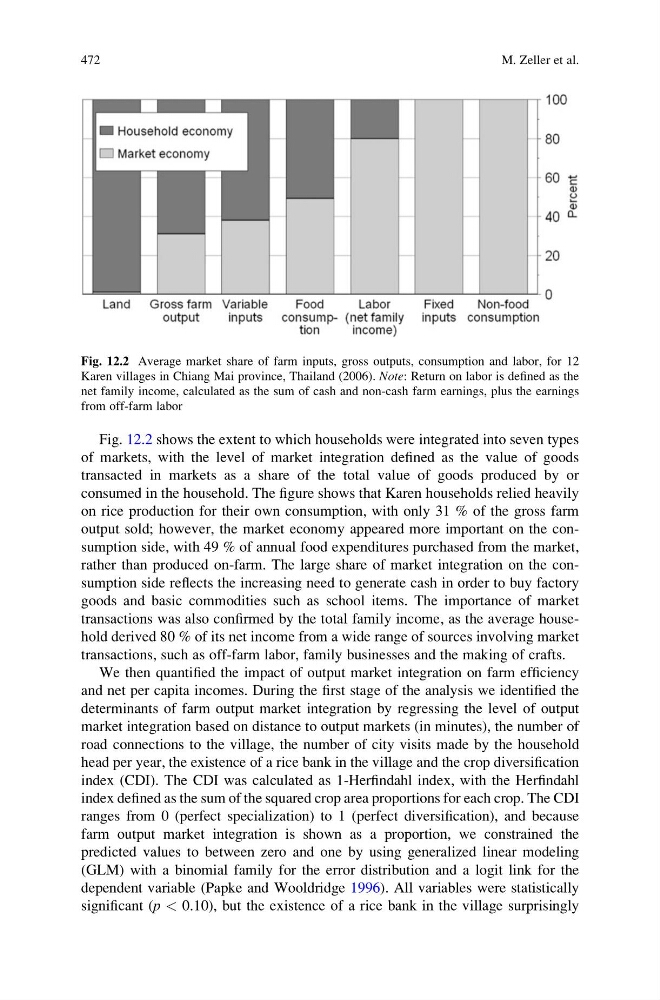
Fig. 12.2 shows the extent to which households were integrated into seven types
of markets, with the level of market integration defined as the value of goods
transacted in markets as a share of the total value of goods produced by or
consumed in the household. The figure shows that Karen households relied heavily
on rice production for their own consumption, with only 31 % of the gross farm
output sold; however, the market economy appeared more important on the consumption side, with 49 % of annual food expenditures purchased from the market,
rather than produced on-farm. The large share of market integration on the consumption side reflects the increasing need to generate cash in order to buy factory
goods and basic commodities such as school items. The importance of market
transactions was also confirmed by the total family income, as the average household derived 80 % of its net income from a wide range of sources involving market
transactions, such as off-farm labor, family businesses and the making of crafts.
We then quantified the impact of output market integration on farm efficiency
and net per capita incomes. During the first stage of the analysis we identified the
determinants of farm output market integration by regressing the level of output
market integration based on distance to output markets (in minutes), the number of
road connections to the village, the number of city visits made by the household
head per year, the existence of a rice bank in the village and the crop diversification
index (CDI). The CDI was calculated as 1-Herfindahl index, with the Herfindahl
index defined as the sum of the squared crop area proportions for each crop. The CDI
ranges from 0 (perfect specialization) to 1 (perfect diversification), and because
farm output market integration is shown as a proportion, we constrained the
predicted values to between zero and one by using generalized linear modeling
(GLM) with a binomial family for the error distribution and a logit link for the
dependent variable (Papke and Wooldridge 1996). All variables were statistically
significant (p < 0.10), but the existence of a rice bank in the village surprisingly
Fig. 12.2 Average market share of farm inputs, gross outputs, consumption and labor, for 12
Karen villages in Chiang Mai province, Thailand (2006). Note: Return on labor is defined as the
net family income, calculated as the sum of cash and non-cash farm earnings, plus the earnings
from off-farm labor
472
M. Zeller et al.
of markets, with the level of market integration defined as the value of goods
transacted in markets as a share of the total value of goods produced by or
consumed in the household. The figure shows that Karen households relied heavily
on rice production for their own consumption, with only 31 % of the gross farm
output sold; however, the market economy appeared more important on the consumption side, with 49 % of annual food expenditures purchased from the market,
rather than produced on-farm. The large share of market integration on the consumption side reflects the increasing need to generate cash in order to buy factory
goods and basic commodities such as school items. The importance of market
transactions was also confirmed by the total family income, as the average household derived 80 % of its net income from a wide range of sources involving market
transactions, such as off-farm labor, family businesses and the making of crafts.
We then quantified the impact of output market integration on farm efficiency
and net per capita incomes. During the first stage of the analysis we identified the
determinants of farm output market integration by regressing the level of output
market integration based on distance to output markets (in minutes), the number of
road connections to the village, the number of city visits made by the household
head per year, the existence of a rice bank in the village and the crop diversification
index (CDI). The CDI was calculated as 1-Herfindahl index, with the Herfindahl
index defined as the sum of the squared crop area proportions for each crop. The CDI
ranges from 0 (perfect specialization) to 1 (perfect diversification), and because
farm output market integration is shown as a proportion, we constrained the
predicted values to between zero and one by using generalized linear modeling
(GLM) with a binomial family for the error distribution and a logit link for the
dependent variable (Papke and Wooldridge 1996). All variables were statistically
significant (p < 0.10), but the existence of a rice bank in the village surprisingly
Fig. 12.2 Average market share of farm inputs, gross outputs, consumption and labor, for 12
Karen villages in Chiang Mai province, Thailand (2006). Note: Return on labor is defined as the
net family income, calculated as the sum of cash and non-cash farm earnings, plus the earnings
from off-farm labor
472
M. Zeller et al.