

increased when the labor requirements were reduced. After labor decreased to 50 %
of the baseline, the adoption rate for leucaena hedges increased to 61 %, when
compared to 53 % in the baseline. The conservation area reached 25.16 ha when
compared to 2.31 ha in the baseline.
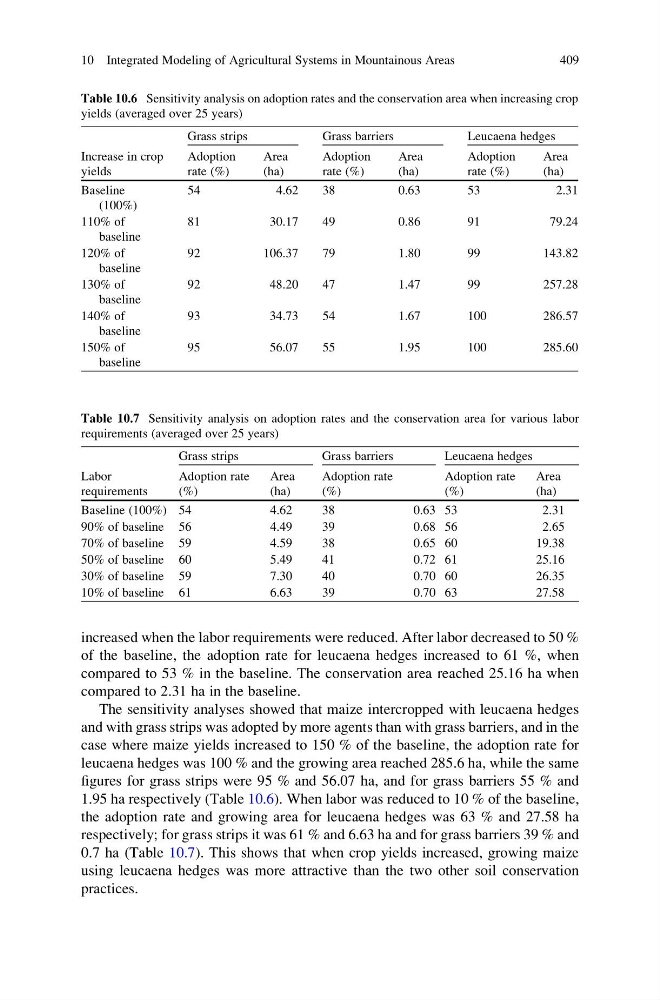
The sensitivity analyses showed that maize intercropped with leucaena hedges
and with grass strips was adopted by more agents than with grass barriers, and in the
case where maize yields increased to 150 % of the baseline, the adoption rate for
leucaena hedges was 100 % and the growing area reached 285.6 ha, while the same
figures for grass strips were 95 % and 56.07 ha, and for grass barriers 55 % and
1.95 ha respectively (Table 10.6). When labor was reduced to 10 % of the baseline,
the adoption rate and growing area for leucaena hedges was 63 % and 27.58 ha
respectively; for grass strips it was 61 % and 6.63 ha and for grass barriers 39 % and
0.7 ha (Table 10.7). This shows that when crop yields increased, growing maize
using leucaena hedges was more attractive than the two other soil conservation
practices.
Table 10.7 Sensitivity analysis on adoption rates and the conservation area for various labor
requirements (averaged over 25 years)
Labor
requirements
Grass strips
Grass barriers
Leucaena hedges
Adoption rate
(%)
Area
(ha)
Adoption rate
(%)
Adoption rate
(%)
Area
(ha)
Baseline (100%) 54
4.62
38
0.63 53
2.31
90% of baseline 56
4.49
39
0.68 56
2.65
70% of baseline 59
4.59
38
0.65 60
19.38
50% of baseline 60
5.49
41
0.72 61
25.16
30% of baseline 59
7.30
40
0.70 60
26.35
10% of baseline 61
6.63
39
0.70 63
27.58
Table 10.6 Sensitivity analysis on adoption rates and the conservation area when increasing crop
yields (averaged over 25 years)
Increase in crop
yields
Grass strips
Grass barriers
Leucaena hedges
Adoption
rate (%)
Area
(ha)
Adoption
rate (%)
Area
(ha)
Adoption
rate (%)
Area
(ha)
Baseline
(100%)
54
4.62
38
0.63
53
2.31
110% of
baseline
81
30.17
49
0.86
91
79.24
120% of
baseline
92
106.37
79
1.80
99
143.82
130% of
baseline
92
48.20
47
1.47
99
257.28
140% of
baseline
93
34.73
54
1.67
100
286.57
150% of
baseline
95
56.07
55
1.95
100
285.60
10 Integrated Modeling of Agricultural Systems in Mountainous Areas
409
of the baseline, the adoption rate for leucaena hedges increased to 61 %, when
compared to 53 % in the baseline. The conservation area reached 25.16 ha when
compared to 2.31 ha in the baseline.
The sensitivity analyses showed that maize intercropped with leucaena hedges
and with grass strips was adopted by more agents than with grass barriers, and in the
case where maize yields increased to 150 % of the baseline, the adoption rate for
leucaena hedges was 100 % and the growing area reached 285.6 ha, while the same
figures for grass strips were 95 % and 56.07 ha, and for grass barriers 55 % and
1.95 ha respectively (Table 10.6). When labor was reduced to 10 % of the baseline,
the adoption rate and growing area for leucaena hedges was 63 % and 27.58 ha
respectively; for grass strips it was 61 % and 6.63 ha and for grass barriers 39 % and
0.7 ha (Table 10.7). This shows that when crop yields increased, growing maize
using leucaena hedges was more attractive than the two other soil conservation
practices.
Table 10.7 Sensitivity analysis on adoption rates and the conservation area for various labor
requirements (averaged over 25 years)
Labor
requirements
Grass strips
Grass barriers
Leucaena hedges
Adoption rate
(%)
Area
(ha)
Adoption rate
(%)
Adoption rate
(%)
Area
(ha)
Baseline (100%) 54
4.62
38
0.63 53
2.31
90% of baseline 56
4.49
39
0.68 56
2.65
70% of baseline 59
4.59
38
0.65 60
19.38
50% of baseline 60
5.49
41
0.72 61
25.16
30% of baseline 59
7.30
40
0.70 60
26.35
10% of baseline 61
6.63
39
0.70 63
27.58
Table 10.6 Sensitivity analysis on adoption rates and the conservation area when increasing crop
yields (averaged over 25 years)
Increase in crop
yields
Grass strips
Grass barriers
Leucaena hedges
Adoption
rate (%)
Area
(ha)
Adoption
rate (%)
Area
(ha)
Adoption
rate (%)
Area
(ha)
Baseline
(100%)
54
4.62
38
0.63
53
2.31
110% of
baseline
81
30.17
49
0.86
91
79.24
120% of
baseline
92
106.37
79
1.80
99
143.82
130% of
baseline
92
48.20
47
1.47
99
257.28
140% of
baseline
93
34.73
54
1.67
100
286.57
150% of
baseline
95
56.07
55
1.95
100
285.60
10 Integrated Modeling of Agricultural Systems in Mountainous Areas
409