

activities in MP were computed from the yield response function, the Revised
Universal Soil Loss Equation (RUSLE) and balance equations respectively.
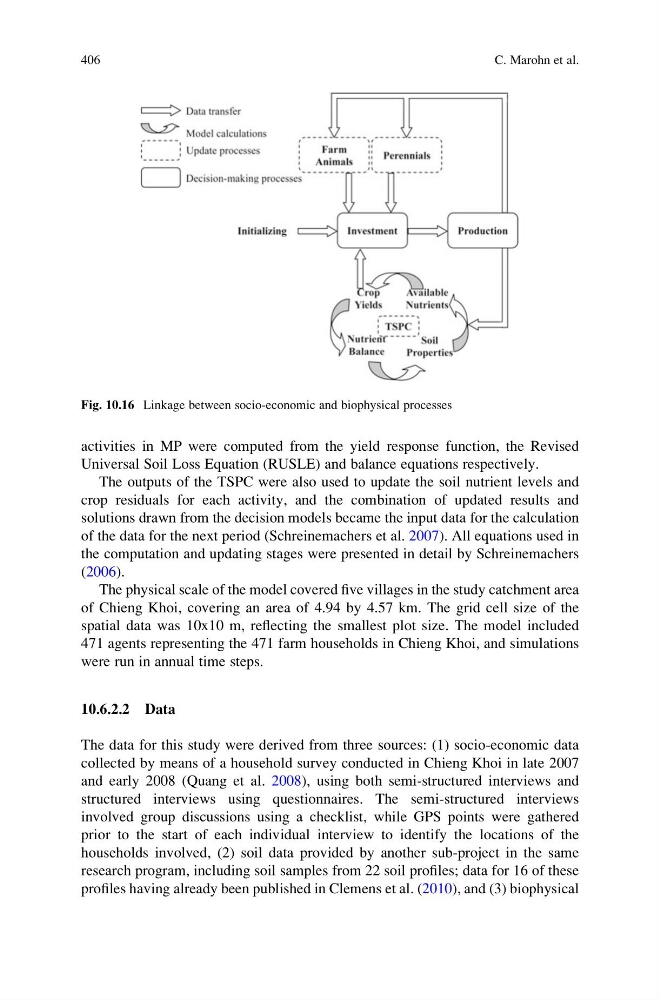
The outputs of the TSPC were also used to update the soil nutrient levels and
crop residuals for each activity, and the combination of updated results and
solutions drawn from the decision models became the input data for the calculation
of the data for the next period (Schreinemachers et al. 2007). All equations used in
the computation and updating stages were presented in detail by Schreinemachers
(2006).
The physical scale of the model covered five villages in the study catchment area
of Chieng Khoi, covering an area of 4.94 by 4.57 km. The grid cell size of the
spatial data was 10x10 m, reflecting the smallest plot size. The model included
471 agents representing the 471 farm households in Chieng Khoi, and simulations
were run in annual time steps.
10.6.2.2 Data
The data for this study were derived from three sources: (1) socio-economic data
collected by means of a household survey conducted in Chieng Khoi in late 2007
and early 2008 (Quang et al. 2008), using both semi-structured interviews and
structured interviews using questionnaires. The semi-structured interviews
involved group discussions using a checklist, while GPS points were gathered
prior to the start of each individual interview to identify the locations of the
households involved, (2) soil data provided by another sub-project in the same
research program, including soil samples from 22 soil profiles; data for 16 of these
profiles having already been published in Clemens et al. (2010), and (3) biophysical
Fig. 10.16 Linkage between socio-economic and biophysical processes
406
C. Marohn et al.
Universal Soil Loss Equation (RUSLE) and balance equations respectively.
The outputs of the TSPC were also used to update the soil nutrient levels and
crop residuals for each activity, and the combination of updated results and
solutions drawn from the decision models became the input data for the calculation
of the data for the next period (Schreinemachers et al. 2007). All equations used in
the computation and updating stages were presented in detail by Schreinemachers
(2006).
The physical scale of the model covered five villages in the study catchment area
of Chieng Khoi, covering an area of 4.94 by 4.57 km. The grid cell size of the
spatial data was 10x10 m, reflecting the smallest plot size. The model included
471 agents representing the 471 farm households in Chieng Khoi, and simulations
were run in annual time steps.
10.6.2.2 Data
The data for this study were derived from three sources: (1) socio-economic data
collected by means of a household survey conducted in Chieng Khoi in late 2007
and early 2008 (Quang et al. 2008), using both semi-structured interviews and
structured interviews using questionnaires. The semi-structured interviews
involved group discussions using a checklist, while GPS points were gathered
prior to the start of each individual interview to identify the locations of the
households involved, (2) soil data provided by another sub-project in the same
research program, including soil samples from 22 soil profiles; data for 16 of these
profiles having already been published in Clemens et al. (2010), and (3) biophysical
Fig. 10.16 Linkage between socio-economic and biophysical processes
406
C. Marohn et al.