

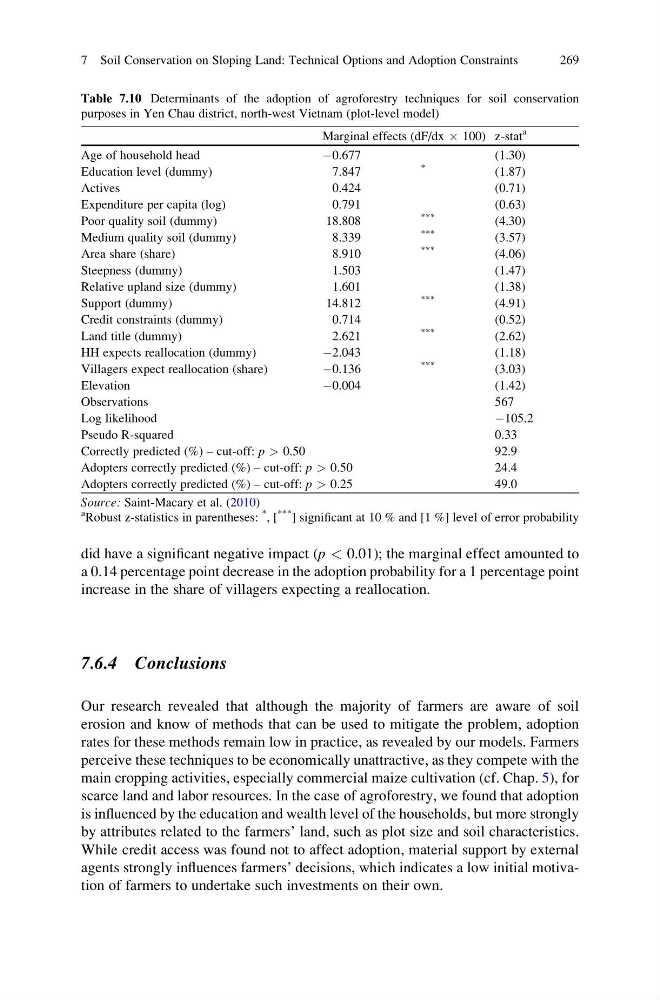
did have a significant negative impact (p < 0.01); the marginal effect amounted to
a 0.14 percentage point decrease in the adoption probability for a 1 percentage point
increase in the share of villagers expecting a reallocation.
7.6.4 Conclusions
Our research revealed that although the majority of farmers are aware of soil
erosion and know of methods that can be used to mitigate the problem, adoption
rates for these methods remain low in practice, as revealed by our models. Farmers
perceive these techniques to be economically unattractive, as they compete with the
main cropping activities, especially commercial maize cultivation (cf. Chap. 5), for
scarce land and labor resources. In the case of agroforestry, we found that adoption
is influenced by the education and wealth level of the households, but more strongly
by attributes related to the farmers’ land, such as plot size and soil characteristics.
While credit access was found not to affect adoption, material support by external
agents strongly influences farmers’ decisions, which indicates a low initial motivation of farmers to undertake such investments on their own.
Table 7.10 Determinants of the adoption of agroforestry techniques for soil conservation
purposes in Yen Chau district, north-west Vietnam (plot-level model)
Marginal effects (dF/dx  100) z-stat
a
Age of household head
À0.677
(1.30)
Education level (dummy)
7.847
*
(1.87)
Actives
0.424
(0.71)
Expenditure per capita (log)
0.791
(0.63)
Poor quality soil (dummy)
18.808
***
(4.30)
Medium quality soil (dummy)
8.339
***
(3.57)
Area share (share)
8.910
***
(4.06)
Steepness (dummy)
1.503
(1.47)
Relative upland size (dummy)
1.601
(1.38)
Support (dummy)
14.812
***
(4.91)
Credit constraints (dummy)
0.714
(0.52)
Land title (dummy)
2.621
***
(2.62)
HH expects reallocation (dummy)
À2.043
(1.18)
Villagers expect reallocation (share)
À0.136
***
(3.03)
Elevation
À0.004
(1.42)
Observations
567
Log likelihood
À105.2
Pseudo R-squared
0.33
Correctly predicted (%) – cut-off: p > 0.50
92.9
Adopters correctly predicted (%) – cut-off: p > 0.50
24.4
Adopters correctly predicted (%) – cut-off: p > 0.25
49.0
Source: Saint-Macary et al. (2010)
a
Robust z-statistics in parentheses:
*
, [
***
] significant at 10 % and [1 %] level of error probability
7 Soil Conservation on Sloping Land: Technical Options and Adoption Constraints
269
a 0.14 percentage point decrease in the adoption probability for a 1 percentage point
increase in the share of villagers expecting a reallocation.
7.6.4 Conclusions
Our research revealed that although the majority of farmers are aware of soil
erosion and know of methods that can be used to mitigate the problem, adoption
rates for these methods remain low in practice, as revealed by our models. Farmers
perceive these techniques to be economically unattractive, as they compete with the
main cropping activities, especially commercial maize cultivation (cf. Chap. 5), for
scarce land and labor resources. In the case of agroforestry, we found that adoption
is influenced by the education and wealth level of the households, but more strongly
by attributes related to the farmers’ land, such as plot size and soil characteristics.
While credit access was found not to affect adoption, material support by external
agents strongly influences farmers’ decisions, which indicates a low initial motivation of farmers to undertake such investments on their own.
Table 7.10 Determinants of the adoption of agroforestry techniques for soil conservation
purposes in Yen Chau district, north-west Vietnam (plot-level model)
Marginal effects (dF/dx  100) z-stat
a
Age of household head
À0.677
(1.30)
Education level (dummy)
7.847
*
(1.87)
Actives
0.424
(0.71)
Expenditure per capita (log)
0.791
(0.63)
Poor quality soil (dummy)
18.808
***
(4.30)
Medium quality soil (dummy)
8.339
***
(3.57)
Area share (share)
8.910
***
(4.06)
Steepness (dummy)
1.503
(1.47)
Relative upland size (dummy)
1.601
(1.38)
Support (dummy)
14.812
***
(4.91)
Credit constraints (dummy)
0.714
(0.52)
Land title (dummy)
2.621
***
(2.62)
HH expects reallocation (dummy)
À2.043
(1.18)
Villagers expect reallocation (share)
À0.136
***
(3.03)
Elevation
À0.004
(1.42)
Observations
567
Log likelihood
À105.2
Pseudo R-squared
0.33
Correctly predicted (%) – cut-off: p > 0.50
92.9
Adopters correctly predicted (%) – cut-off: p > 0.50
24.4
Adopters correctly predicted (%) – cut-off: p > 0.25
49.0
Source: Saint-Macary et al. (2010)
a
Robust z-statistics in parentheses:
*
, [
***
] significant at 10 % and [1 %] level of error probability
7 Soil Conservation on Sloping Land: Technical Options and Adoption Constraints
269