

Malaysia, Thailand, Philippines and Vietnam. Pesticide use in Laos, Cambodia and
Myanmar on the other hand, remains relatively low, since these countries have not
yet experienced the same type of rapid agricultural change as other countries in the
region.
In Thailand and Vietnam, pesticides were first introduced in the mid-1950s and
their use remained relatively modest until economic development accelerated. In
Vietnam, this acceleration can be dated to the start of economic liberalization in the
mid-1980s, when the private sector was allowed to engage in pesticide importation
and distribution and when farmers were given use rights over their agricultural land,
allowing them to make independent farm management decisions. From 1991 to 1998,
the volume of agricultural pesticides, as formulated products (that is, active
ingredients as well as inert ingredients such as solvents, emulsifiers and adjuvant),
increased from 20 million to 30 million kg and subsequently to 77 million kg in 2007,
which suggests an average annual growth rate of 8.5 % over this 16-year period.
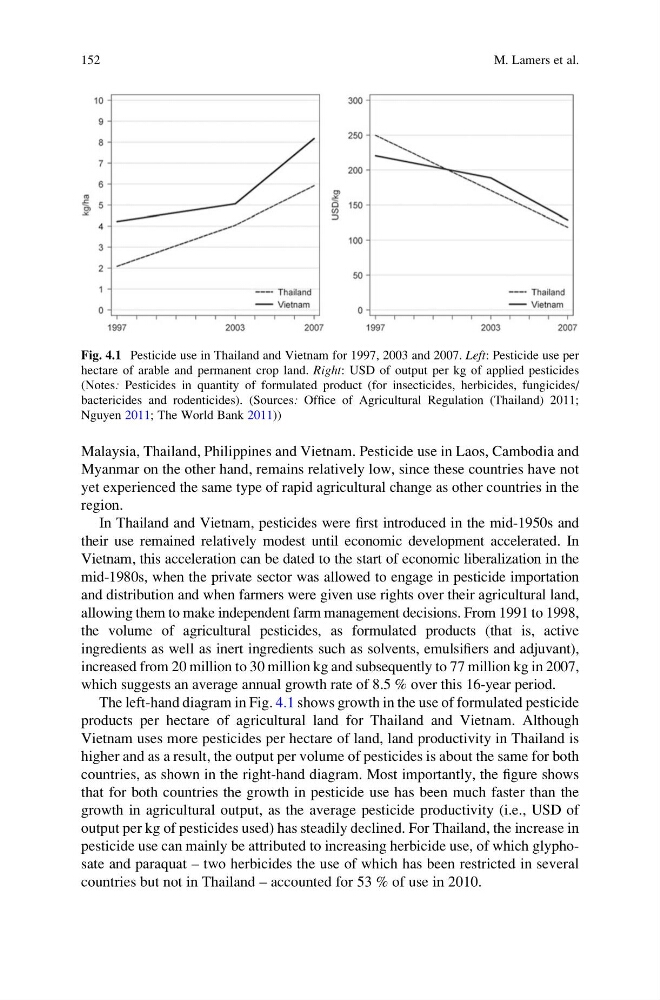
The left-hand diagram in Fig. 4.1 shows growth in the use of formulated pesticide
products per hectare of agricultural land for Thailand and Vietnam. Although
Vietnam uses more pesticides per hectare of land, land productivity in Thailand is
higher and as a result, the output per volume of pesticides is about the same for both
countries, as shown in the right-hand diagram. Most importantly, the figure shows
that for both countries the growth in pesticide use has been much faster than the
growth in agricultural output, as the average pesticide productivity (i.e., USD of
output per kg of pesticides used) has steadily declined. For Thailand, the increase in
pesticide use can mainly be attributed to increasing herbicide use, of which glyphosate and paraquat – two herbicides the use of which has been restricted in several
countries but not in Thailand – accounted for 53 % of use in 2010.
Fig. 4.1 Pesticide use in Thailand and Vietnam for 1997, 2003 and 2007. Left: Pesticide use per
hectare of arable and permanent crop land. Right: USD of output per kg of applied pesticides
(Notes: Pesticides in quantity of formulated product (for insecticides, herbicides, fungicides/
bactericides and rodenticides). (Sources: Office of Agricultural Regulation (Thailand) 2011;
Nguyen 2011; The World Bank 2011))
152
M. Lamers et al.
Myanmar on the other hand, remains relatively low, since these countries have not
yet experienced the same type of rapid agricultural change as other countries in the
region.
In Thailand and Vietnam, pesticides were first introduced in the mid-1950s and
their use remained relatively modest until economic development accelerated. In
Vietnam, this acceleration can be dated to the start of economic liberalization in the
mid-1980s, when the private sector was allowed to engage in pesticide importation
and distribution and when farmers were given use rights over their agricultural land,
allowing them to make independent farm management decisions. From 1991 to 1998,
the volume of agricultural pesticides, as formulated products (that is, active
ingredients as well as inert ingredients such as solvents, emulsifiers and adjuvant),
increased from 20 million to 30 million kg and subsequently to 77 million kg in 2007,
which suggests an average annual growth rate of 8.5 % over this 16-year period.
The left-hand diagram in Fig. 4.1 shows growth in the use of formulated pesticide
products per hectare of agricultural land for Thailand and Vietnam. Although
Vietnam uses more pesticides per hectare of land, land productivity in Thailand is
higher and as a result, the output per volume of pesticides is about the same for both
countries, as shown in the right-hand diagram. Most importantly, the figure shows
that for both countries the growth in pesticide use has been much faster than the
growth in agricultural output, as the average pesticide productivity (i.e., USD of
output per kg of pesticides used) has steadily declined. For Thailand, the increase in
pesticide use can mainly be attributed to increasing herbicide use, of which glyphosate and paraquat – two herbicides the use of which has been restricted in several
countries but not in Thailand – accounted for 53 % of use in 2010.
Fig. 4.1 Pesticide use in Thailand and Vietnam for 1997, 2003 and 2007. Left: Pesticide use per
hectare of arable and permanent crop land. Right: USD of output per kg of applied pesticides
(Notes: Pesticides in quantity of formulated product (for insecticides, herbicides, fungicides/
bactericides and rodenticides). (Sources: Office of Agricultural Regulation (Thailand) 2011;
Nguyen 2011; The World Bank 2011))
152
M. Lamers et al.