

(7 km
2 ). The two other stations – Pha Muang at the outlet of the watershed and Pong
Yaeng at the headwater area, came into operation at the beginning of the third phase
of the Program in 2007, and ran until the end of 2011. The Pong Yaeng station
measured over an area of 22 km
2 .
The altitude within the Mae Sa watershed ranges from 350 to 1,540 m above sea
level (m.a.s.l.) In particular the headwater and Mae Sa Noi sub-catchments are
characterized by steep slopes and narrow valleys, while on the watershed scale, the
average slope is 36 %. Soils within the watershed consist mainly of Acrisols and
Cambisols, which have a highly developed macropore network (Schuler 2008).
Within the watershed, about 24 % of the area is used for agriculture and settlements,
while the remainder is covered with deciduous primary and secondary forest. The
agricultural area is mostly used for the production of vegetables (e.g., cabbages, bell
peppers and chayote), fruit (e.g., litchi) and flowers (e.g., Gerbera spp. and Chrysanthemum spp.). Within the headwater catchment in particular, vegetables and
flowers are intensively produced in greenhouses. For more details on this see
Sangchan et al. (2012).
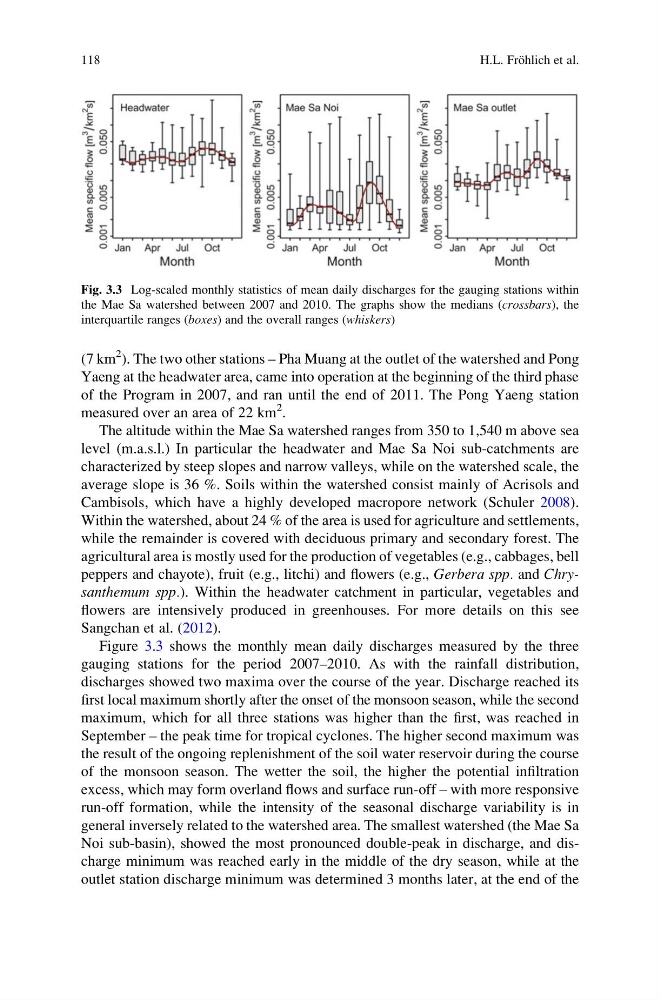
Figure 3.3 shows the monthly mean daily discharges measured by the three
gauging stations for the period 2007–2010. As with the rainfall distribution,
discharges showed two maxima over the course of the year. Discharge reached its
first local maximum shortly after the onset of the monsoon season, while the second
maximum, which for all three stations was higher than the first, was reached in
September – the peak time for tropical cyclones. The higher second maximum was
the result of the ongoing replenishment of the soil water reservoir during the course
of the monsoon season. The wetter the soil, the higher the potential infiltration
excess, which may form overland flows and surface run-off – with more responsive
run-off formation, while the intensity of the seasonal discharge variability is in
general inversely related to the watershed area. The smallest watershed (the Mae Sa
Noi sub-basin), showed the most pronounced double-peak in discharge, and discharge minimum was reached early in the middle of the dry season, while at the
outlet station discharge minimum was determined 3 months later, at the end of the
Fig. 3.3 Log-scaled monthly statistics of mean daily discharges for the gauging stations within
the Mae Sa watershed between 2007 and 2010. The graphs show the medians (crossbars), the
interquartile ranges (boxes) and the overall ranges (whiskers)
118
H.L. Fro ¨hlich et al.
2 ). The two other stations – Pha Muang at the outlet of the watershed and Pong
Yaeng at the headwater area, came into operation at the beginning of the third phase
of the Program in 2007, and ran until the end of 2011. The Pong Yaeng station
measured over an area of 22 km
2 .
The altitude within the Mae Sa watershed ranges from 350 to 1,540 m above sea
level (m.a.s.l.) In particular the headwater and Mae Sa Noi sub-catchments are
characterized by steep slopes and narrow valleys, while on the watershed scale, the
average slope is 36 %. Soils within the watershed consist mainly of Acrisols and
Cambisols, which have a highly developed macropore network (Schuler 2008).
Within the watershed, about 24 % of the area is used for agriculture and settlements,
while the remainder is covered with deciduous primary and secondary forest. The
agricultural area is mostly used for the production of vegetables (e.g., cabbages, bell
peppers and chayote), fruit (e.g., litchi) and flowers (e.g., Gerbera spp. and Chrysanthemum spp.). Within the headwater catchment in particular, vegetables and
flowers are intensively produced in greenhouses. For more details on this see
Sangchan et al. (2012).
Figure 3.3 shows the monthly mean daily discharges measured by the three
gauging stations for the period 2007–2010. As with the rainfall distribution,
discharges showed two maxima over the course of the year. Discharge reached its
first local maximum shortly after the onset of the monsoon season, while the second
maximum, which for all three stations was higher than the first, was reached in
September – the peak time for tropical cyclones. The higher second maximum was
the result of the ongoing replenishment of the soil water reservoir during the course
of the monsoon season. The wetter the soil, the higher the potential infiltration
excess, which may form overland flows and surface run-off – with more responsive
run-off formation, while the intensity of the seasonal discharge variability is in
general inversely related to the watershed area. The smallest watershed (the Mae Sa
Noi sub-basin), showed the most pronounced double-peak in discharge, and discharge minimum was reached early in the middle of the dry season, while at the
outlet station discharge minimum was determined 3 months later, at the end of the
Fig. 3.3 Log-scaled monthly statistics of mean daily discharges for the gauging stations within
the Mae Sa watershed between 2007 and 2010. The graphs show the medians (crossbars), the
interquartile ranges (boxes) and the overall ranges (whiskers)
118
H.L. Fro ¨hlich et al.