

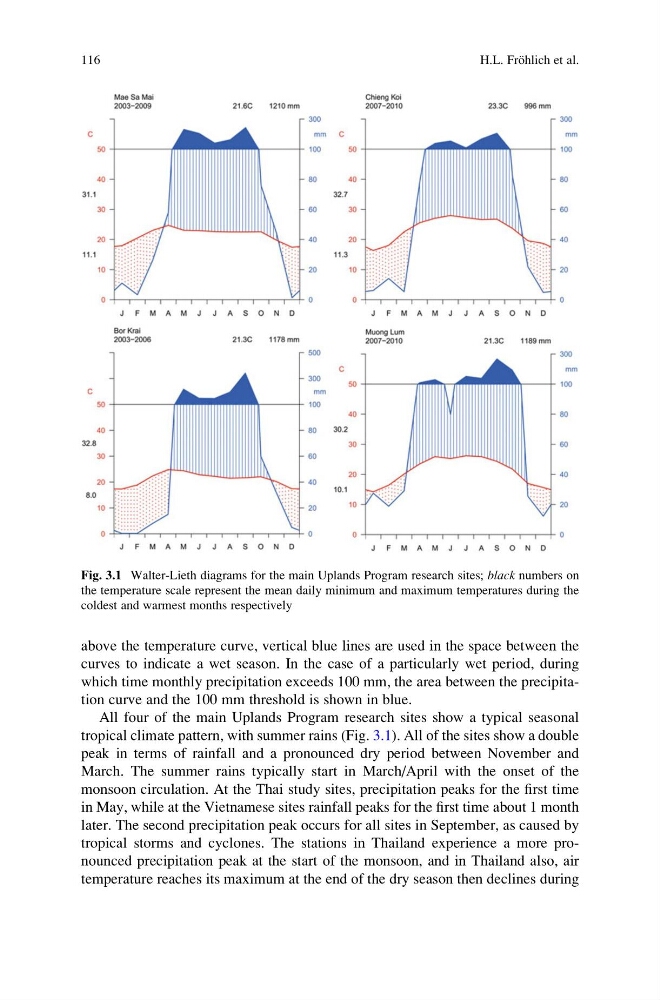
above the temperature curve, vertical blue lines are used in the space between the
curves to indicate a wet season. In the case of a particularly wet period, during
which time monthly precipitation exceeds 100 mm, the area between the precipitation curve and the 100 mm threshold is shown in blue.
All four of the main Uplands Program research sites show a typical seasonal
tropical climate pattern, with summer rains (Fig. 3.1). All of the sites show a double
peak in terms of rainfall and a pronounced dry period between November and
March. The summer rains typically start in March/April with the onset of the
monsoon circulation. At the Thai study sites, precipitation peaks for the first time
in May, while at the Vietnamese sites rainfall peaks for the first time about 1 month
later. The second precipitation peak occurs for all sites in September, as caused by
tropical storms and cyclones. The stations in Thailand experience a more pronounced precipitation peak at the start of the monsoon, and in Thailand also, air
temperature reaches its maximum at the end of the dry season then declines during
Fig. 3.1 Walter-Lieth diagrams for the main Uplands Program research sites; black numbers on
the temperature scale represent the mean daily minimum and maximum temperatures during the
coldest and warmest months respectively
116
H.L. Fro ¨hlich et al.
curves to indicate a wet season. In the case of a particularly wet period, during
which time monthly precipitation exceeds 100 mm, the area between the precipitation curve and the 100 mm threshold is shown in blue.
All four of the main Uplands Program research sites show a typical seasonal
tropical climate pattern, with summer rains (Fig. 3.1). All of the sites show a double
peak in terms of rainfall and a pronounced dry period between November and
March. The summer rains typically start in March/April with the onset of the
monsoon circulation. At the Thai study sites, precipitation peaks for the first time
in May, while at the Vietnamese sites rainfall peaks for the first time about 1 month
later. The second precipitation peak occurs for all sites in September, as caused by
tropical storms and cyclones. The stations in Thailand experience a more pronounced precipitation peak at the start of the monsoon, and in Thailand also, air
temperature reaches its maximum at the end of the dry season then declines during
Fig. 3.1 Walter-Lieth diagrams for the main Uplands Program research sites; black numbers on
the temperature scale represent the mean daily minimum and maximum temperatures during the
coldest and warmest months respectively
116
H.L. Fro ¨hlich et al.