

2.6.3 Effect of Erosion on Soil Fertility
Comparison of the nutrient stocks of undisturbed soils and arable land:
Stocks of Nt and available cations (S-value), as well as bulk density (BD) and
soil organic carbon content (Corg) of the topsoil, were used as indicators for the
impact of land use on soil fertility (Fig. 2.17). All the cultivated sites had a lower
Corg content in the top layer when compared to the reference sites. Remarkably, in
BD-L and in ML-C, bulk density increased (not in BD), with negative effects on air
capacity, available water capacity and infiltration rates. The expected reduction in
Nt stocks and S-values, as caused by erosion, was not verified on the 41 and 31
year-old maize plots in BD-C and ML-L, as in both cases, the topographic situation,
con profiling and presence of foot slopes resulted in sedimentation. A deep transition horizon (Bt-Ah, at 14–30 cm depths) with a relatively high Corg content
(20 mg kg
À1 ) in BD-C, and a deep Ah horizon (at 4–40 cm depths) with a high
Corg content (25.4 mg kg
À1 ) in ML-L, provided proof of this assumption.
A statistical analysis of the data from the six reference sites (Fig. 2.18) revealed
small standard deviations of the mean Corg (11.6 Æ 2.3 kg/m
2
), Nt (1.3 Æ 0.1 kg/m
2
)
and S-value (134.7 Æ 6.1 mol/m
2 ). The number of observations was not enough to
test for significant differences in the parent materials of the reference sites; therefore, the sites were grouped in order to test for the effect of deforestation and
subsequent arable use on all the cultivated soils. The resulting statistical analysis
revealed significantly (p < 0.05) higher stocks of Corg and Nt in the effective root
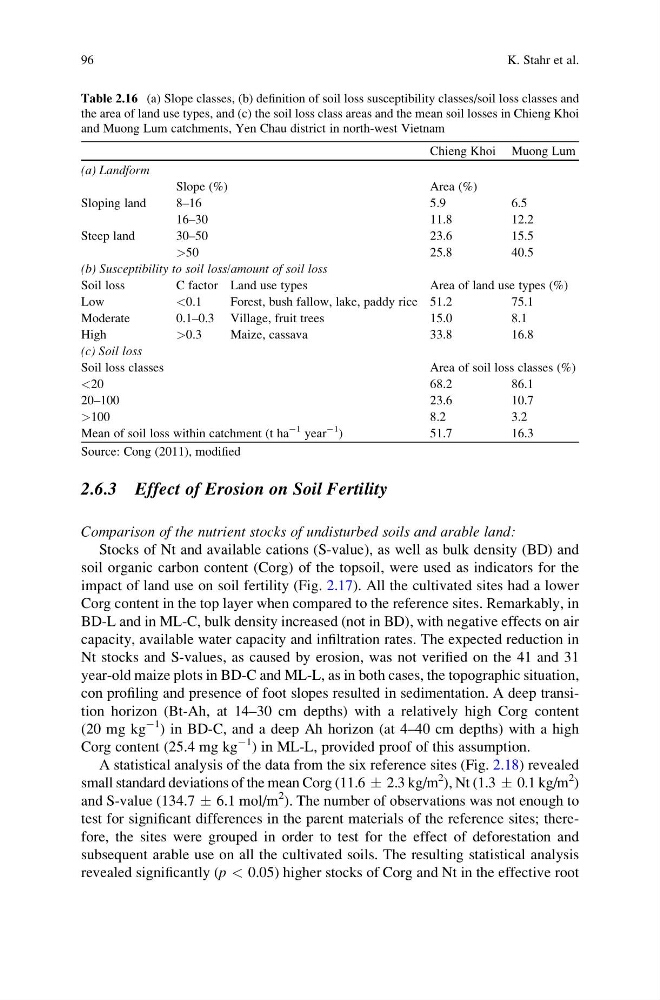
Table 2.16 (a) Slope classes, (b) definition of soil loss susceptibility classes/soil loss classes and
the area of land use types, and (c) the soil loss class areas and the mean soil losses in Chieng Khoi
and Muong Lum catchments, Yen Chau district in north-west Vietnam
Chieng Khoi Muong Lum
(a) Landform
Slope (%)
Area (%)
Sloping land
8–16
5.9
6.5
16–30
11.8
12.2
Steep land
30–50
23.6
15.5
>50
25.8
40.5
(b) Susceptibility to soil loss/amount of soil loss
Soil loss
C factor Land use types
Area of land use types (%)
Low
<0.1
Forest, bush fallow, lake, paddy rice 51.2
75.1
Moderate
0.1–0.3 Village, fruit trees
15.0
8.1
High
>0.3
Maize, cassava
33.8
16.8
(c) Soil loss
Soil loss classes
Area of soil loss classes (%)
<20
68.2
86.1
20–100
23.6
10.7
>100
8.2
3.2
Mean of soil loss within catchment (t ha
À1 year
À1
)
51.7
16.3
Source: Cong (2011), modified
96
K. Stahr et al.
Comparison of the nutrient stocks of undisturbed soils and arable land:
Stocks of Nt and available cations (S-value), as well as bulk density (BD) and
soil organic carbon content (Corg) of the topsoil, were used as indicators for the
impact of land use on soil fertility (Fig. 2.17). All the cultivated sites had a lower
Corg content in the top layer when compared to the reference sites. Remarkably, in
BD-L and in ML-C, bulk density increased (not in BD), with negative effects on air
capacity, available water capacity and infiltration rates. The expected reduction in
Nt stocks and S-values, as caused by erosion, was not verified on the 41 and 31
year-old maize plots in BD-C and ML-L, as in both cases, the topographic situation,
con profiling and presence of foot slopes resulted in sedimentation. A deep transition horizon (Bt-Ah, at 14–30 cm depths) with a relatively high Corg content
(20 mg kg
À1 ) in BD-C, and a deep Ah horizon (at 4–40 cm depths) with a high
Corg content (25.4 mg kg
À1 ) in ML-L, provided proof of this assumption.
A statistical analysis of the data from the six reference sites (Fig. 2.18) revealed
small standard deviations of the mean Corg (11.6 Æ 2.3 kg/m
2
), Nt (1.3 Æ 0.1 kg/m
2
)
and S-value (134.7 Æ 6.1 mol/m
2 ). The number of observations was not enough to
test for significant differences in the parent materials of the reference sites; therefore, the sites were grouped in order to test for the effect of deforestation and
subsequent arable use on all the cultivated soils. The resulting statistical analysis
revealed significantly (p < 0.05) higher stocks of Corg and Nt in the effective root
Table 2.16 (a) Slope classes, (b) definition of soil loss susceptibility classes/soil loss classes and
the area of land use types, and (c) the soil loss class areas and the mean soil losses in Chieng Khoi
and Muong Lum catchments, Yen Chau district in north-west Vietnam
Chieng Khoi Muong Lum
(a) Landform
Slope (%)
Area (%)
Sloping land
8–16
5.9
6.5
16–30
11.8
12.2
Steep land
30–50
23.6
15.5
>50
25.8
40.5
(b) Susceptibility to soil loss/amount of soil loss
Soil loss
C factor Land use types
Area of land use types (%)
Low
<0.1
Forest, bush fallow, lake, paddy rice 51.2
75.1
Moderate
0.1–0.3 Village, fruit trees
15.0
8.1
High
>0.3
Maize, cassava
33.8
16.8
(c) Soil loss
Soil loss classes
Area of soil loss classes (%)
<20
68.2
86.1
20–100
23.6
10.7
>100
8.2
3.2
Mean of soil loss within catchment (t ha
À1 year
À1
)
51.7
16.3
Source: Cong (2011), modified
96
K. Stahr et al.