

490
7 Applications: Pebble Flow Optimizations
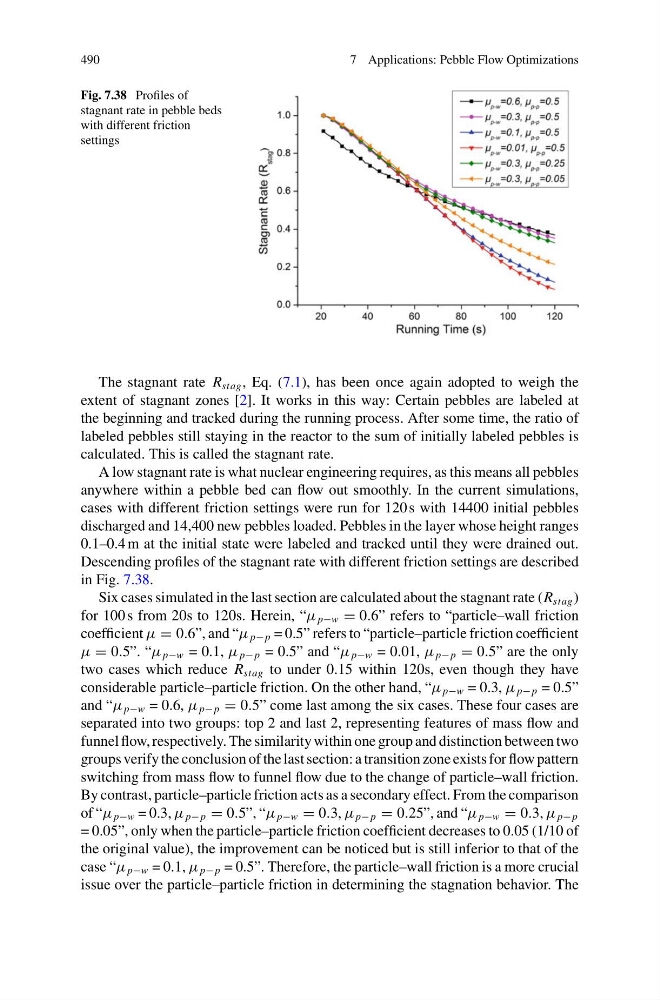
Fig. 7.38 Profiles of
stagnant rate in pebble beds
with different friction
settings
The stagnant rate R stag , Eq. (7.1), has been once again adopted to weigh the
extent of stagnant zones [2]. It works in this way: Certain pebbles are labeled at
the beginning and tracked during the running process. After some time, the ratio of
labeled pebbles still staying in the reactor to the sum of initially labeled pebbles is
calculated. This is called the stagnant rate.
A low stagnant rate is what nuclear engineering requires, as this means all pebbles
anywhere within a pebble bed can flow out smoothly. In the current simulations,
cases with different friction settings were run for 120 s with 14400 initial pebbles
discharged and 14,400 new pebbles loaded. Pebbles in the layer whose height ranges
0.1–0.4 m at the initial state were labeled and tracked until they were drained out.
Descending profiles of the stagnant rate with different friction settings are described
in Fig. 7.38.
Six cases simulated in the last section are calculated about the stagnant rate (R stag )
for 100 s from 20s to 120s. Herein, “μ p−w = 0.6” refers to “particle–wall friction
coefficient μ = 0.6”, and “μ p− p = 0.5” refers to “particle–particle friction coefficient
μ = 0.5”. “μ p−w = 0.1, μ p− p = 0.5” and “μ p−w = 0.01, μ p− p = 0.5” are the only
two cases which reduce R stag to under 0.15 within 120s, even though they have
considerable particle–particle friction. On the other hand, “μ p−w = 0.3, μ p− p = 0.5”
and “μ p−w = 0.6, μ p− p = 0.5” come last among the six cases. These four cases are
separated into two groups: top 2 and last 2, representing features of mass flow and
funnel flow, respectively. The similarity within one group and distinction between two
groups verify the conclusion of the last section: a transition zone exists for flow pattern
switching from mass flow to funnel flow due to the change of particle–wall friction.
By contrast, particle–particle friction acts as a secondary effect. From the comparison
of “μ p−w = 0.3, μ p− p = 0.5”, “μ p−w = 0.3, μ p− p = 0.25”, and “μ p−w = 0.3, μ p− p
= 0.05”, only when the particle–particle friction coefficient decreases to 0.05 (1/10 of
the original value), the improvement can be noticed but is still inferior to that of the
case “μ p−w = 0.1, μ p− p = 0.5”. Therefore, the particle–wall friction is a more crucial
issue over the particle–particle friction in determining the stagnation behavior. The
7 Applications: Pebble Flow Optimizations
Fig. 7.38 Profiles of
stagnant rate in pebble beds
with different friction
settings
The stagnant rate R stag , Eq. (7.1), has been once again adopted to weigh the
extent of stagnant zones [2]. It works in this way: Certain pebbles are labeled at
the beginning and tracked during the running process. After some time, the ratio of
labeled pebbles still staying in the reactor to the sum of initially labeled pebbles is
calculated. This is called the stagnant rate.
A low stagnant rate is what nuclear engineering requires, as this means all pebbles
anywhere within a pebble bed can flow out smoothly. In the current simulations,
cases with different friction settings were run for 120 s with 14400 initial pebbles
discharged and 14,400 new pebbles loaded. Pebbles in the layer whose height ranges
0.1–0.4 m at the initial state were labeled and tracked until they were drained out.
Descending profiles of the stagnant rate with different friction settings are described
in Fig. 7.38.
Six cases simulated in the last section are calculated about the stagnant rate (R stag )
for 100 s from 20s to 120s. Herein, “μ p−w = 0.6” refers to “particle–wall friction
coefficient μ = 0.6”, and “μ p− p = 0.5” refers to “particle–particle friction coefficient
μ = 0.5”. “μ p−w = 0.1, μ p− p = 0.5” and “μ p−w = 0.01, μ p− p = 0.5” are the only
two cases which reduce R stag to under 0.15 within 120s, even though they have
considerable particle–particle friction. On the other hand, “μ p−w = 0.3, μ p− p = 0.5”
and “μ p−w = 0.6, μ p− p = 0.5” come last among the six cases. These four cases are
separated into two groups: top 2 and last 2, representing features of mass flow and
funnel flow, respectively. The similarity within one group and distinction between two
groups verify the conclusion of the last section: a transition zone exists for flow pattern
switching from mass flow to funnel flow due to the change of particle–wall friction.
By contrast, particle–particle friction acts as a secondary effect. From the comparison
of “μ p−w = 0.3, μ p− p = 0.5”, “μ p−w = 0.3, μ p− p = 0.25”, and “μ p−w = 0.3, μ p− p
= 0.05”, only when the particle–particle friction coefficient decreases to 0.05 (1/10 of
the original value), the improvement can be noticed but is still inferior to that of the
case “μ p−w = 0.1, μ p− p = 0.5”. Therefore, the particle–wall friction is a more crucial
issue over the particle–particle friction in determining the stagnation behavior. The