

7.2 Wall Structure Optimization
447
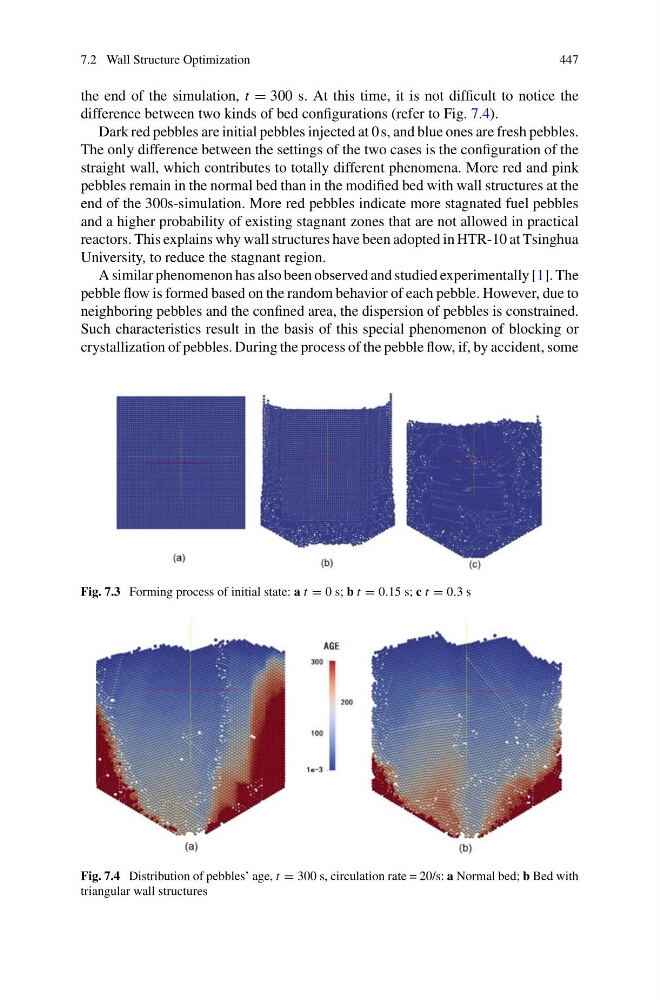
the end of the simulation, t = 300 s. At this time, it is not difficult to notice the
difference between two kinds of bed configurations (refer to Fig. 7.4).
Dark red pebbles are initial pebbles injected at 0 s, and blue ones are fresh pebbles.
The only difference between the settings of the two cases is the configuration of the
straight wall, which contributes to totally different phenomena. More red and pink
pebbles remain in the normal bed than in the modified bed with wall structures at the
end of the 300s-simulation. More red pebbles indicate more stagnated fuel pebbles
and a higher probability of existing stagnant zones that are not allowed in practical
reactors. This explains why wall structures have been adopted in HTR-10 at Tsinghua
University, to reduce the stagnant region.
A similar phenomenon has also been observed and studied experimentally [1]. The
pebble flow is formed based on the random behavior of each pebble. However, due to
neighboring pebbles and the confined area, the dispersion of pebbles is constrained.
Such characteristics result in the basis of this special phenomenon of blocking or
crystallization of pebbles. During the process of the pebble flow, if, by accident, some
Fig. 7.3 Forming process of initial state: a t = 0 s; b t = 0.15 s; c t = 0.3 s
Fig. 7.4 Distribution of pebbles’ age, t = 300 s, circulation rate = 20/s: a Normal bed; b Bed with
triangular wall structures
447
the end of the simulation, t = 300 s. At this time, it is not difficult to notice the
difference between two kinds of bed configurations (refer to Fig. 7.4).
Dark red pebbles are initial pebbles injected at 0 s, and blue ones are fresh pebbles.
The only difference between the settings of the two cases is the configuration of the
straight wall, which contributes to totally different phenomena. More red and pink
pebbles remain in the normal bed than in the modified bed with wall structures at the
end of the 300s-simulation. More red pebbles indicate more stagnated fuel pebbles
and a higher probability of existing stagnant zones that are not allowed in practical
reactors. This explains why wall structures have been adopted in HTR-10 at Tsinghua
University, to reduce the stagnant region.
A similar phenomenon has also been observed and studied experimentally [1]. The
pebble flow is formed based on the random behavior of each pebble. However, due to
neighboring pebbles and the confined area, the dispersion of pebbles is constrained.
Such characteristics result in the basis of this special phenomenon of blocking or
crystallization of pebbles. During the process of the pebble flow, if, by accident, some
Fig. 7.3 Forming process of initial state: a t = 0 s; b t = 0.15 s; c t = 0.3 s
Fig. 7.4 Distribution of pebbles’ age, t = 300 s, circulation rate = 20/s: a Normal bed; b Bed with
triangular wall structures