

446
7 Applications: Pebble Flow Optimizations
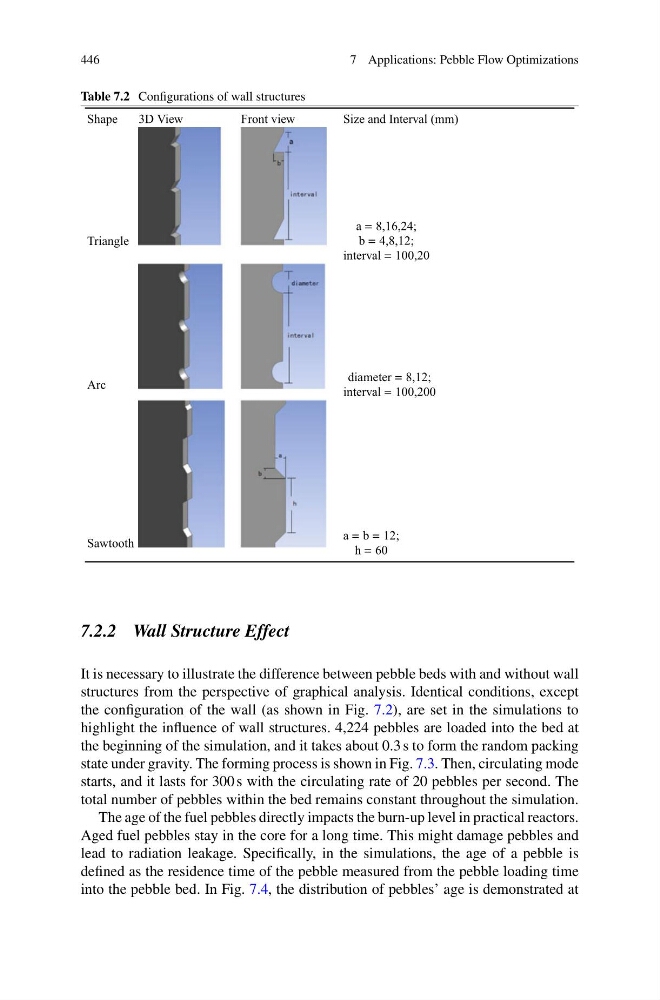
Table 7.2 Configurations of wall structures
Shape
3D View
Front view
Size and Interval (mm)
Triangle
a 8,16,24;
b 4,8,12;
interval 100,20
Arc
diameter 8,12;
interval 100,200
Sawtooth
a b 12;
h 60
7.2.2 Wall Structure Effect
It is necessary to illustrate the difference between pebble beds with and without wall
structures from the perspective of graphical analysis. Identical conditions, except
the configuration of the wall (as shown in Fig. 7.2), are set in the simulations to
highlight the influence of wall structures. 4,224 pebbles are loaded into the bed at
the beginning of the simulation, and it takes about 0.3 s to form the random packing
state under gravity. The forming process is shown in Fig. 7.3. Then, circulating mode
starts, and it lasts for 300 s with the circulating rate of 20 pebbles per second. The
total number of pebbles within the bed remains constant throughout the simulation.
The age of the fuel pebbles directly impacts the burn-up level in practical reactors.
Aged fuel pebbles stay in the core for a long time. This might damage pebbles and
lead to radiation leakage. Specifically, in the simulations, the age of a pebble is
defined as the residence time of the pebble measured from the pebble loading time
into the pebble bed. In Fig. 7.4, the distribution of pebbles’ age is demonstrated at
7 Applications: Pebble Flow Optimizations
Table 7.2 Configurations of wall structures
Shape
3D View
Front view
Size and Interval (mm)
Triangle
a 8,16,24;
b 4,8,12;
interval 100,20
Arc
diameter 8,12;
interval 100,200
Sawtooth
a b 12;
h 60
7.2.2 Wall Structure Effect
It is necessary to illustrate the difference between pebble beds with and without wall
structures from the perspective of graphical analysis. Identical conditions, except
the configuration of the wall (as shown in Fig. 7.2), are set in the simulations to
highlight the influence of wall structures. 4,224 pebbles are loaded into the bed at
the beginning of the simulation, and it takes about 0.3 s to form the random packing
state under gravity. The forming process is shown in Fig. 7.3. Then, circulating mode
starts, and it lasts for 300 s with the circulating rate of 20 pebbles per second. The
total number of pebbles within the bed remains constant throughout the simulation.
The age of the fuel pebbles directly impacts the burn-up level in practical reactors.
Aged fuel pebbles stay in the core for a long time. This might damage pebbles and
lead to radiation leakage. Specifically, in the simulations, the age of a pebble is
defined as the residence time of the pebble measured from the pebble loading time
into the pebble bed. In Fig. 7.4, the distribution of pebbles’ age is demonstrated at