

6.3 Density Difference and Loading Ratio Effects
431
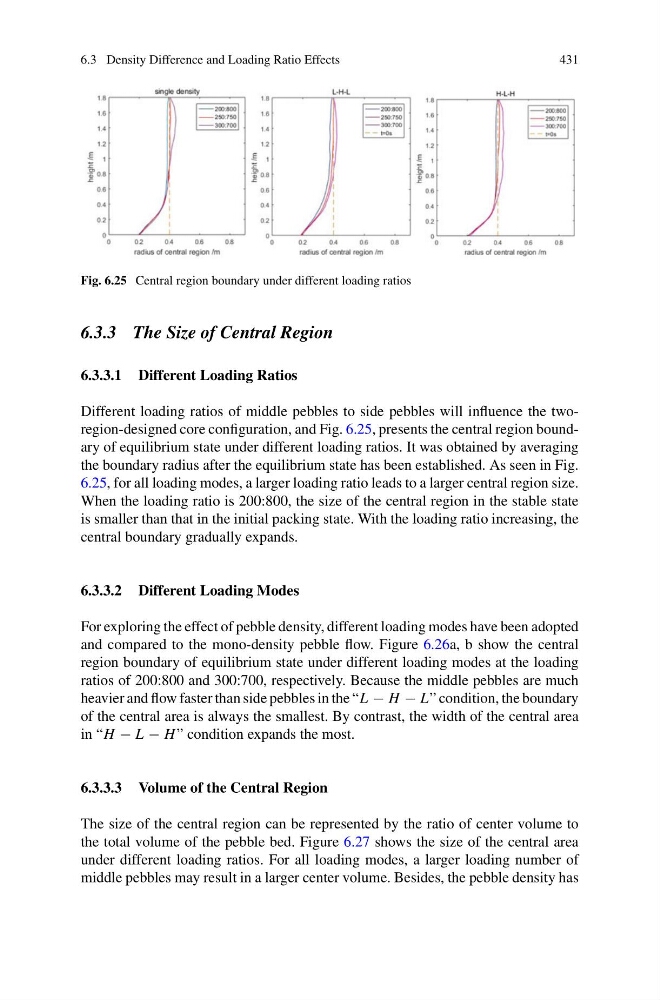
Fig. 6.25 Central region boundary under different loading ratios
6.3.3 The Size of Central Region
6.3.3.1 Different Loading Ratios
Different loading ratios of middle pebbles to side pebbles will influence the tworegion-designed core configuration, and Fig. 6.25, presents the central region boundary of equilibrium state under different loading ratios. It was obtained by averaging
the boundary radius after the equilibrium state has been established. As seen in Fig.
6.25, for all loading modes, a larger loading ratio leads to a larger central region size.
When the loading ratio is 200:800, the size of the central region in the stable state
is smaller than that in the initial packing state. With the loading ratio increasing, the
central boundary gradually expands.
6.3.3.2 Different Loading Modes
For exploring the effect of pebble density, different loading modes have been adopted
and compared to the mono-density pebble flow. Figure 6.26a, b show the central
region boundary of equilibrium state under different loading modes at the loading
ratios of 200:800 and 300:700, respectively. Because the middle pebbles are much
heavier and flow faster than side pebbles in the “L − H − L” condition, the boundary
of the central area is always the smallest. By contrast, the width of the central area
in “H − L − H ” condition expands the most.
6.3.3.3 Volume of the Central Region
The size of the central region can be represented by the ratio of center volume to
the total volume of the pebble bed. Figure 6.27 shows the size of the central area
under different loading ratios. For all loading modes, a larger loading number of
middle pebbles may result in a larger center volume. Besides, the pebble density has
431
Fig. 6.25 Central region boundary under different loading ratios
6.3.3 The Size of Central Region
6.3.3.1 Different Loading Ratios
Different loading ratios of middle pebbles to side pebbles will influence the tworegion-designed core configuration, and Fig. 6.25, presents the central region boundary of equilibrium state under different loading ratios. It was obtained by averaging
the boundary radius after the equilibrium state has been established. As seen in Fig.
6.25, for all loading modes, a larger loading ratio leads to a larger central region size.
When the loading ratio is 200:800, the size of the central region in the stable state
is smaller than that in the initial packing state. With the loading ratio increasing, the
central boundary gradually expands.
6.3.3.2 Different Loading Modes
For exploring the effect of pebble density, different loading modes have been adopted
and compared to the mono-density pebble flow. Figure 6.26a, b show the central
region boundary of equilibrium state under different loading modes at the loading
ratios of 200:800 and 300:700, respectively. Because the middle pebbles are much
heavier and flow faster than side pebbles in the “L − H − L” condition, the boundary
of the central area is always the smallest. By contrast, the width of the central area
in “H − L − H ” condition expands the most.
6.3.3.3 Volume of the Central Region
The size of the central region can be represented by the ratio of center volume to
the total volume of the pebble bed. Figure 6.27 shows the size of the central area
under different loading ratios. For all loading modes, a larger loading number of
middle pebbles may result in a larger center volume. Besides, the pebble density has