

422
6 Applications: Two-Region Pebble Beds
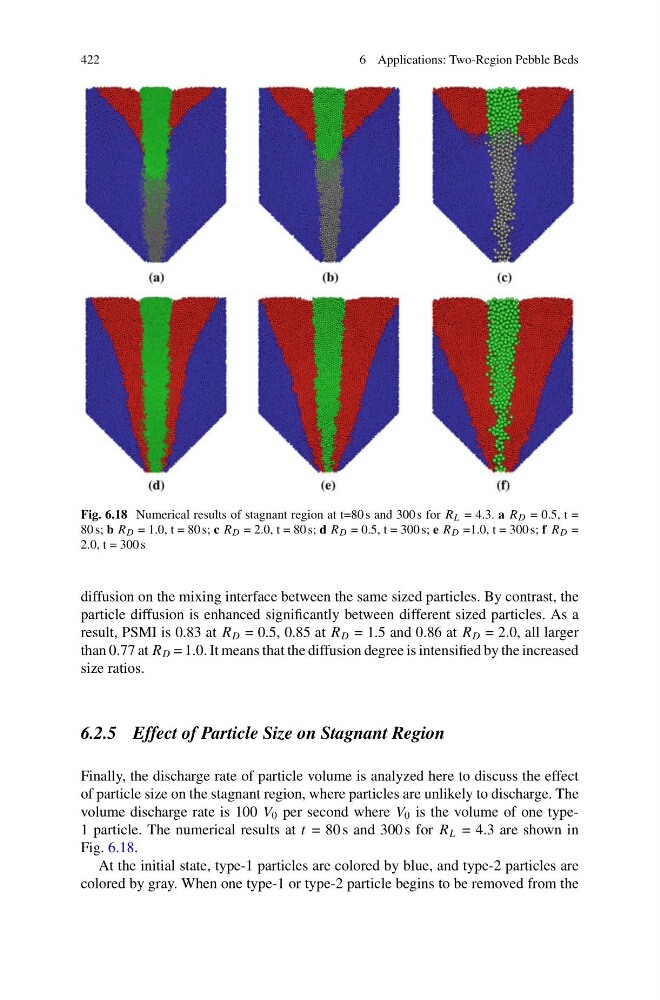
Fig. 6.18 Numerical results of stagnant region at t=80 s and 300 s for R L = 4.3. a R D = 0.5, t =
80 s; b R D = 1.0, t = 80s; c R D = 2.0, t = 80s; d R D = 0.5, t = 300 s; e R D =1.0, t = 300 s; f R D =
2.0, t = 300 s
diffusion on the mixing interface between the same sized particles. By contrast, the
particle diffusion is enhanced significantly between different sized particles. As a
result, PSMI is 0.83 at R D = 0.5, 0.85 at R D = 1.5 and 0.86 at R D = 2.0, all larger
than 0.77 at R D = 1.0. It means that the diffusion degree is intensified by the increased
size ratios.
6.2.5 Effect of Particle Size on Stagnant Region
Finally, the discharge rate of particle volume is analyzed here to discuss the effect
of particle size on the stagnant region, where particles are unlikely to discharge. The
volume discharge rate is 100 V 0 per second where V 0 is the volume of one type1 particle. The numerical results at t = 80 s and 300 s for R L = 4.3 are shown in
Fig. 6.18.
At the initial state, type-1 particles are colored by blue, and type-2 particles are
colored by gray. When one type-1 or type-2 particle begins to be removed from the
6 Applications: Two-Region Pebble Beds
Fig. 6.18 Numerical results of stagnant region at t=80 s and 300 s for R L = 4.3. a R D = 0.5, t =
80 s; b R D = 1.0, t = 80s; c R D = 2.0, t = 80s; d R D = 0.5, t = 300 s; e R D =1.0, t = 300 s; f R D =
2.0, t = 300 s
diffusion on the mixing interface between the same sized particles. By contrast, the
particle diffusion is enhanced significantly between different sized particles. As a
result, PSMI is 0.83 at R D = 0.5, 0.85 at R D = 1.5 and 0.86 at R D = 2.0, all larger
than 0.77 at R D = 1.0. It means that the diffusion degree is intensified by the increased
size ratios.
6.2.5 Effect of Particle Size on Stagnant Region
Finally, the discharge rate of particle volume is analyzed here to discuss the effect
of particle size on the stagnant region, where particles are unlikely to discharge. The
volume discharge rate is 100 V 0 per second where V 0 is the volume of one type1 particle. The numerical results at t = 80 s and 300 s for R L = 4.3 are shown in
Fig. 6.18.
At the initial state, type-1 particles are colored by blue, and type-2 particles are
colored by gray. When one type-1 or type-2 particle begins to be removed from the