

6.1 Experimental Measurements
403
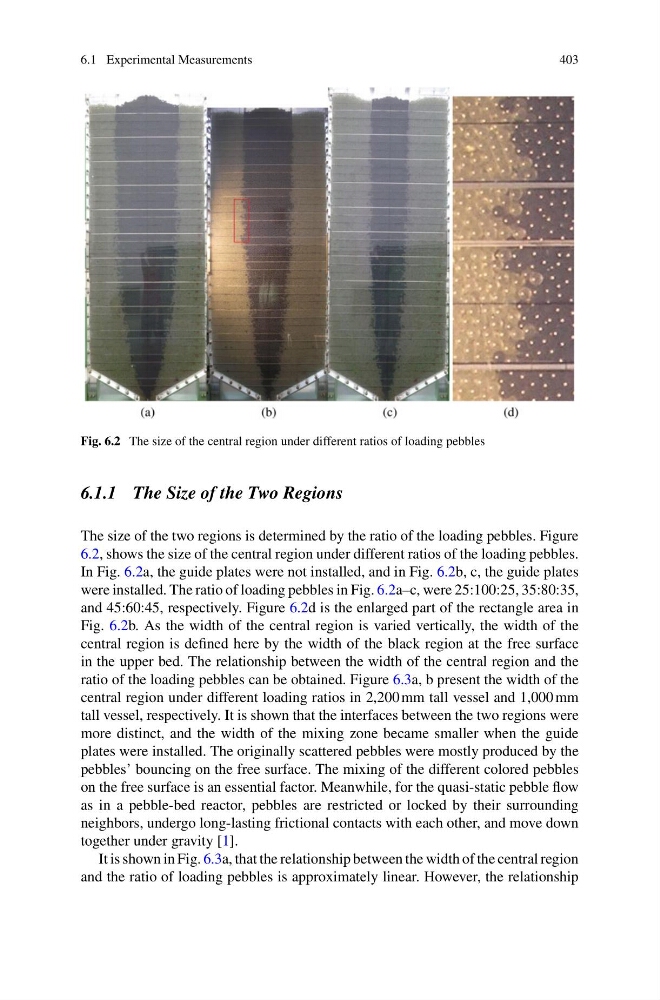
Fig. 6.2 The size of the central region under different ratios of loading pebbles
6.1.1 The Size of the Two Regions
The size of the two regions is determined by the ratio of the loading pebbles. Figure
6.2, shows the size of the central region under different ratios of the loading pebbles.
In Fig. 6.2a, the guide plates were not installed, and in Fig. 6.2b, c, the guide plates
were installed. The ratio of loading pebbles in Fig. 6.2a–c, were 25:100:25, 35:80:35,
and 45:60:45, respectively. Figure 6.2d is the enlarged part of the rectangle area in
Fig. 6.2b. As the width of the central region is varied vertically, the width of the
central region is defined here by the width of the black region at the free surface
in the upper bed. The relationship between the width of the central region and the
ratio of the loading pebbles can be obtained. Figure 6.3a, b present the width of the
central region under different loading ratios in 2,200 mm tall vessel and 1,000 mm
tall vessel, respectively. It is shown that the interfaces between the two regions were
more distinct, and the width of the mixing zone became smaller when the guide
plates were installed. The originally scattered pebbles were mostly produced by the
pebbles’ bouncing on the free surface. The mixing of the different colored pebbles
on the free surface is an essential factor. Meanwhile, for the quasi-static pebble flow
as in a pebble-bed reactor, pebbles are restricted or locked by their surrounding
neighbors, undergo long-lasting frictional contacts with each other, and move down
together under gravity [1].
It is shown in Fig. 6.3a, that the relationship between the width of the central region
and the ratio of loading pebbles is approximately linear. However, the relationship
403
Fig. 6.2 The size of the central region under different ratios of loading pebbles
6.1.1 The Size of the Two Regions
The size of the two regions is determined by the ratio of the loading pebbles. Figure
6.2, shows the size of the central region under different ratios of the loading pebbles.
In Fig. 6.2a, the guide plates were not installed, and in Fig. 6.2b, c, the guide plates
were installed. The ratio of loading pebbles in Fig. 6.2a–c, were 25:100:25, 35:80:35,
and 45:60:45, respectively. Figure 6.2d is the enlarged part of the rectangle area in
Fig. 6.2b. As the width of the central region is varied vertically, the width of the
central region is defined here by the width of the black region at the free surface
in the upper bed. The relationship between the width of the central region and the
ratio of the loading pebbles can be obtained. Figure 6.3a, b present the width of the
central region under different loading ratios in 2,200 mm tall vessel and 1,000 mm
tall vessel, respectively. It is shown that the interfaces between the two regions were
more distinct, and the width of the mixing zone became smaller when the guide
plates were installed. The originally scattered pebbles were mostly produced by the
pebbles’ bouncing on the free surface. The mixing of the different colored pebbles
on the free surface is an essential factor. Meanwhile, for the quasi-static pebble flow
as in a pebble-bed reactor, pebbles are restricted or locked by their surrounding
neighbors, undergo long-lasting frictional contacts with each other, and move down
together under gravity [1].
It is shown in Fig. 6.3a, that the relationship between the width of the central region
and the ratio of loading pebbles is approximately linear. However, the relationship