

384
5 Numerical Models for Pebble-Bed Heat Transfer
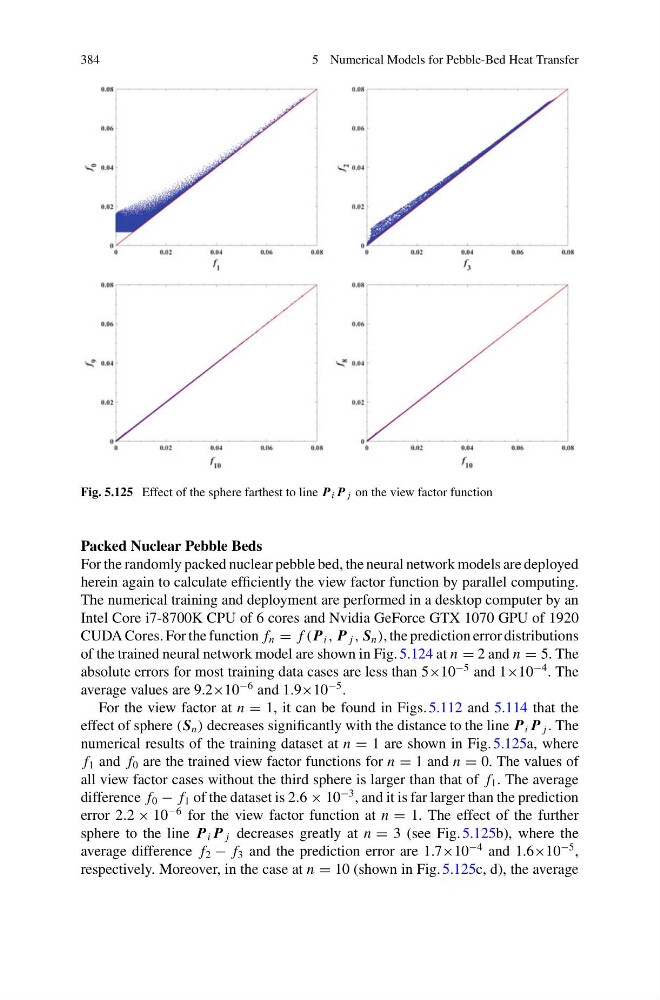
Fig. 5.125 Effect of the sphere farthest to line P i P j on the view factor function
Packed Nuclear Pebble Beds
For the randomly packed nuclear pebble bed, the neural network models are deployed
herein again to calculate efficiently the view factor function by parallel computing.
The numerical training and deployment are performed in a desktop computer by an
Intel Core i7-8700K CPU of 6 cores and Nvidia GeForce GTX 1070 GPU of 1920
CUDA Cores. For the function f n = f ( P i , P j , S n ), the prediction error distributions
of the trained neural network model are shown in Fig. 5.124 at n = 2 and n = 5. The
absolute errors for most training data cases are less than 5×10
−5 and 1×10
−4 . The
average values are 9.2×10
−6 and 1.9×10
−5 .
For the view factor at n = 1, it can be found in Figs. 5.112 and 5.114 that the
effect of sphere (S n ) decreases significantly with the distance to the line P i P j . The
numerical results of the training dataset at n = 1 are shown in Fig.5.125a, where
f 1 and f 0 are the trained view factor functions for n = 1 and n = 0. The values of
all view factor cases without the third sphere is larger than that of f 1 . The average
difference f 0 − f 1 of the dataset is 2.6 × 10
−3 , and it is far larger than the prediction
error 2.2 × 10
−6 for the view factor function at n = 1. The effect of the further
sphere to the line P i P j decreases greatly at n = 3 (see Fig.5.125b), where the
average difference f 2 − f 3 and the prediction error are 1.7×10
−4 and 1.6×10
−5 ,
respectively. Moreover, in the case at n = 10 (shown in Fig. 5.125c, d), the average
5 Numerical Models for Pebble-Bed Heat Transfer
Fig. 5.125 Effect of the sphere farthest to line P i P j on the view factor function
Packed Nuclear Pebble Beds
For the randomly packed nuclear pebble bed, the neural network models are deployed
herein again to calculate efficiently the view factor function by parallel computing.
The numerical training and deployment are performed in a desktop computer by an
Intel Core i7-8700K CPU of 6 cores and Nvidia GeForce GTX 1070 GPU of 1920
CUDA Cores. For the function f n = f ( P i , P j , S n ), the prediction error distributions
of the trained neural network model are shown in Fig. 5.124 at n = 2 and n = 5. The
absolute errors for most training data cases are less than 5×10
−5 and 1×10
−4 . The
average values are 9.2×10
−6 and 1.9×10
−5 .
For the view factor at n = 1, it can be found in Figs. 5.112 and 5.114 that the
effect of sphere (S n ) decreases significantly with the distance to the line P i P j . The
numerical results of the training dataset at n = 1 are shown in Fig.5.125a, where
f 1 and f 0 are the trained view factor functions for n = 1 and n = 0. The values of
all view factor cases without the third sphere is larger than that of f 1 . The average
difference f 0 − f 1 of the dataset is 2.6 × 10
−3 , and it is far larger than the prediction
error 2.2 × 10
−6 for the view factor function at n = 1. The effect of the further
sphere to the line P i P j decreases greatly at n = 3 (see Fig.5.125b), where the
average difference f 2 − f 3 and the prediction error are 1.7×10
−4 and 1.6×10
−5 ,
respectively. Moreover, in the case at n = 10 (shown in Fig. 5.125c, d), the average