

5.4 CFD-DEM Coupled Simulation and Development
339
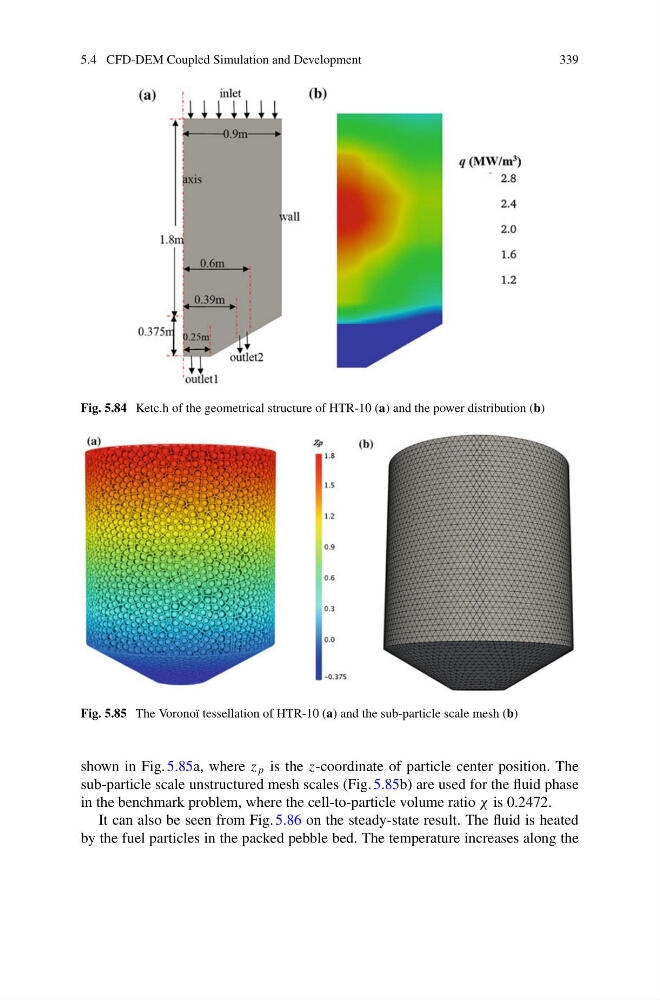
Fig. 5.84 Ketc.h of the geometrical structure of HTR-10 (a) and the power distribution (b)
Fig. 5.85 The Voronoï tessellation of HTR-10 (a) and the sub-particle scale mesh (b)
shown in Fig.5.85a, where z p is the z-coordinate of particle center position. The
sub-particle scale unstructured mesh scales (Fig. 5.85b) are used for the fluid phase
in the benchmark problem, where the cell-to-particle volume ratio χ is 0.2472.
It can also be seen from Fig. 5.86 on the steady-state result. The fluid is heated
by the fuel particles in the packed pebble bed. The temperature increases along the
339
Fig. 5.84 Ketc.h of the geometrical structure of HTR-10 (a) and the power distribution (b)
Fig. 5.85 The Voronoï tessellation of HTR-10 (a) and the sub-particle scale mesh (b)
shown in Fig.5.85a, where z p is the z-coordinate of particle center position. The
sub-particle scale unstructured mesh scales (Fig. 5.85b) are used for the fluid phase
in the benchmark problem, where the cell-to-particle volume ratio χ is 0.2472.
It can also be seen from Fig. 5.86 on the steady-state result. The fluid is heated
by the fuel particles in the packed pebble bed. The temperature increases along the