

5.4 CFD-DEM Coupled Simulation and Development
337
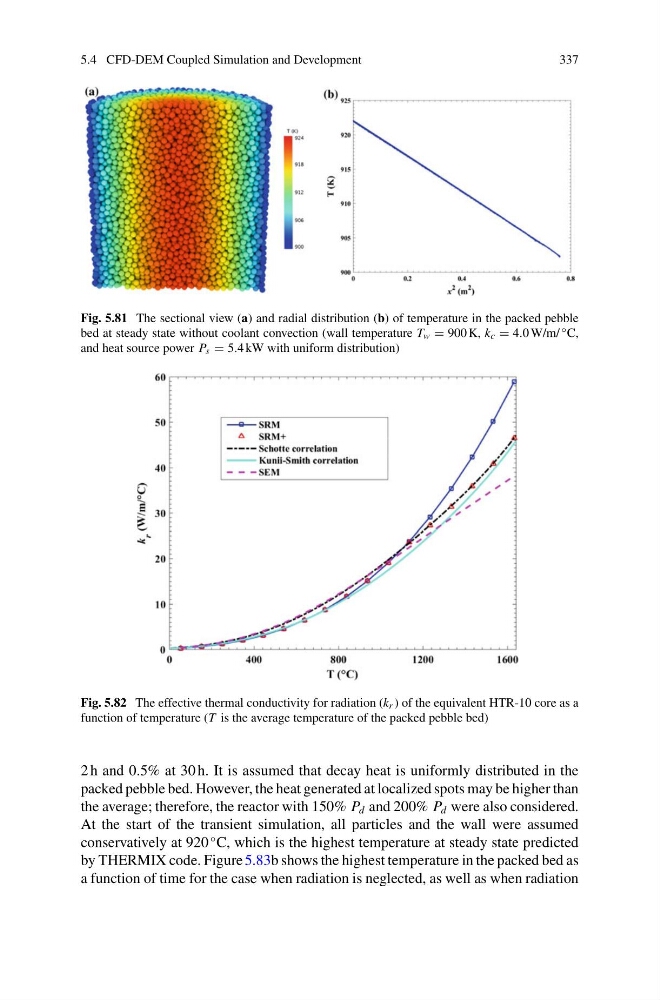
Fig. 5.81 The sectional view (a) and radial distribution (b) of temperature in the packed pebble
bed at steady state without coolant convection (wall temperature T w = 900 K, k c = 4.0 W/m/ ◦ C,
and heat source power P s = 5.4 kW with uniform distribution)
Fig. 5.82 The effective thermal conductivity for radiation (k r ) of the equivalent HTR-10 core as a
function of temperature (T is the average temperature of the packed pebble bed)
2 h and 0.5% at 30 h. It is assumed that decay heat is uniformly distributed in the
packed pebble bed. However, the heat generated at localized spots may be higher than
the average; therefore, the reactor with 150% P d and 200% P d were also considered.
At the start of the transient simulation, all particles and the wall were assumed
conservatively at 920
◦ C, which is the highest temperature at steady state predicted
by THERMIX code. Figure 5.83b shows the highest temperature in the packed bed as
a function of time for the case when radiation is neglected, as well as when radiation
337
Fig. 5.81 The sectional view (a) and radial distribution (b) of temperature in the packed pebble
bed at steady state without coolant convection (wall temperature T w = 900 K, k c = 4.0 W/m/ ◦ C,
and heat source power P s = 5.4 kW with uniform distribution)
Fig. 5.82 The effective thermal conductivity for radiation (k r ) of the equivalent HTR-10 core as a
function of temperature (T is the average temperature of the packed pebble bed)
2 h and 0.5% at 30 h. It is assumed that decay heat is uniformly distributed in the
packed pebble bed. However, the heat generated at localized spots may be higher than
the average; therefore, the reactor with 150% P d and 200% P d were also considered.
At the start of the transient simulation, all particles and the wall were assumed
conservatively at 920
◦ C, which is the highest temperature at steady state predicted
by THERMIX code. Figure 5.83b shows the highest temperature in the packed bed as
a function of time for the case when radiation is neglected, as well as when radiation