

302
5 Numerical Models for Pebble-Bed Heat Transfer
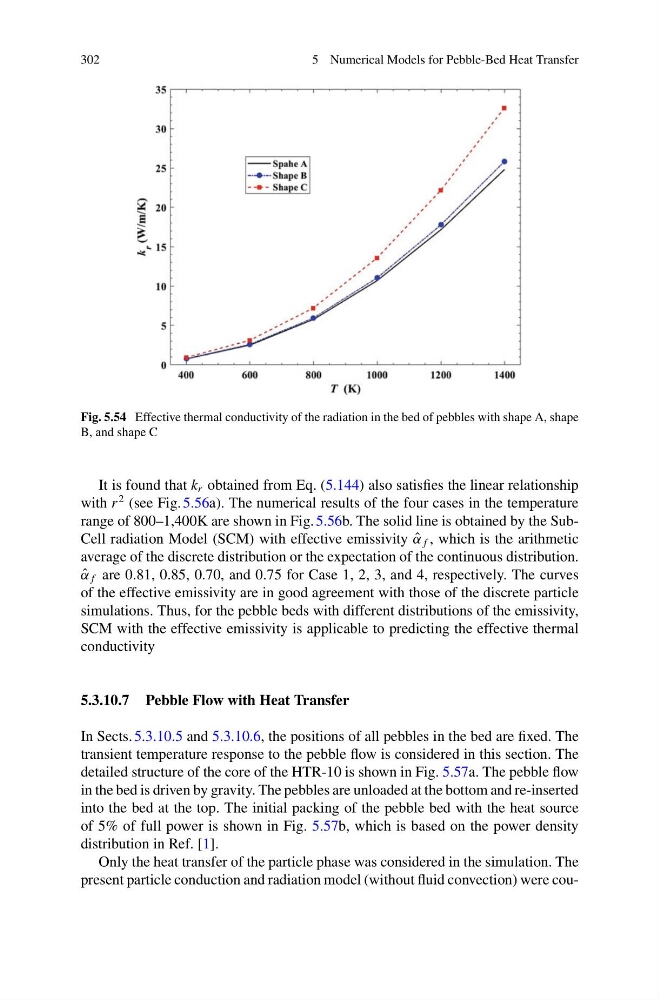
Fig. 5.54 Effective thermal conductivity of the radiation in the bed of pebbles with shape A, shape
B, and shape C
It is found that k r obtained from Eq. (5.144) also satisfies the linear relationship
with r
2 (see Fig. 5.56a). The numerical results of the four cases in the temperature
range of 800–1,400K are shown in Fig. 5.56b. The solid line is obtained by the SubCell radiation Model (SCM) with effective emissivity ˆ
α f , which is the arithmetic
average of the discrete distribution or the expectation of the continuous distribution.
ˆ
α f are 0.81, 0.85, 0.70, and 0.75 for Case 1, 2, 3, and 4, respectively. The curves
of the effective emissivity are in good agreement with those of the discrete particle
simulations. Thus, for the pebble beds with different distributions of the emissivity,
SCM with the effective emissivity is applicable to predicting the effective thermal
conductivity
5.3.10.7 Pebble Flow with Heat Transfer
In Sects. 5.3.10.5 and 5.3.10.6, the positions of all pebbles in the bed are fixed. The
transient temperature response to the pebble flow is considered in this section. The
detailed structure of the core of the HTR-10 is shown in Fig. 5.57a. The pebble flow
in the bed is driven by gravity. The pebbles are unloaded at the bottom and re-inserted
into the bed at the top. The initial packing of the pebble bed with the heat source
of 5% of full power is shown in Fig. 5.57b, which is based on the power density
distribution in Ref. [1].
Only the heat transfer of the particle phase was considered in the simulation. The
present particle conduction and radiation model (without fluid convection) were cou-
5 Numerical Models for Pebble-Bed Heat Transfer
Fig. 5.54 Effective thermal conductivity of the radiation in the bed of pebbles with shape A, shape
B, and shape C
It is found that k r obtained from Eq. (5.144) also satisfies the linear relationship
with r
2 (see Fig. 5.56a). The numerical results of the four cases in the temperature
range of 800–1,400K are shown in Fig. 5.56b. The solid line is obtained by the SubCell radiation Model (SCM) with effective emissivity ˆ
α f , which is the arithmetic
average of the discrete distribution or the expectation of the continuous distribution.
ˆ
α f are 0.81, 0.85, 0.70, and 0.75 for Case 1, 2, 3, and 4, respectively. The curves
of the effective emissivity are in good agreement with those of the discrete particle
simulations. Thus, for the pebble beds with different distributions of the emissivity,
SCM with the effective emissivity is applicable to predicting the effective thermal
conductivity
5.3.10.7 Pebble Flow with Heat Transfer
In Sects. 5.3.10.5 and 5.3.10.6, the positions of all pebbles in the bed are fixed. The
transient temperature response to the pebble flow is considered in this section. The
detailed structure of the core of the HTR-10 is shown in Fig. 5.57a. The pebble flow
in the bed is driven by gravity. The pebbles are unloaded at the bottom and re-inserted
into the bed at the top. The initial packing of the pebble bed with the heat source
of 5% of full power is shown in Fig. 5.57b, which is based on the power density
distribution in Ref. [1].
Only the heat transfer of the particle phase was considered in the simulation. The
present particle conduction and radiation model (without fluid convection) were cou-