

280
5 Numerical Models for Pebble-Bed Heat Transfer
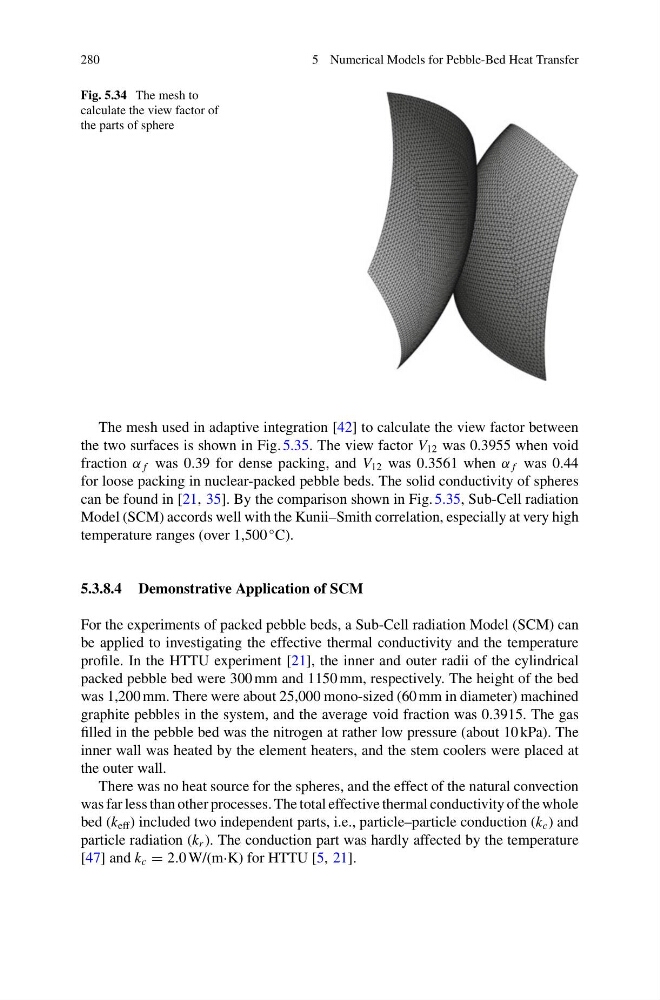
Fig. 5.34 The mesh to
calculate the view factor of
the parts of sphere
The mesh used in adaptive integration [42] to calculate the view factor between
the two surfaces is shown in Fig. 5.35. The view factor V 12 was 0.3955 when void
fraction α f was 0.39 for dense packing, and V 12 was 0.3561 when α f was 0.44
for loose packing in nuclear-packed pebble beds. The solid conductivity of spheres
can be found in [21, 35]. By the comparison shown in Fig. 5.35, Sub-Cell radiation
Model (SCM) accords well with the Kunii–Smith correlation, especially at very high
temperature ranges (over 1,500
◦ C).
5.3.8.4 Demonstrative Application of SCM
For the experiments of packed pebble beds, a Sub-Cell radiation Model (SCM) can
be applied to investigating the effective thermal conductivity and the temperature
profile. In the HTTU experiment [21], the inner and outer radii of the cylindrical
packed pebble bed were 300 mm and 1150 mm, respectively. The height of the bed
was 1,200 mm. There were about 25,000 mono-sized (60 mm in diameter) machined
graphite pebbles in the system, and the average void fraction was 0.3915. The gas
filled in the pebble bed was the nitrogen at rather low pressure (about 10 kPa). The
inner wall was heated by the element heaters, and the stem coolers were placed at
the outer wall.
There was no heat source for the spheres, and the effect of the natural convection
was far less than other processes. The total effective thermal conductivity of the whole
bed (k eff ) included two independent parts, i.e., particle–particle conduction (k c ) and
particle radiation (k r ). The conduction part was hardly affected by the temperature
[47] and k c = 2.0 W/(m·K) for HTTU [5, 21].
5 Numerical Models for Pebble-Bed Heat Transfer
Fig. 5.34 The mesh to
calculate the view factor of
the parts of sphere
The mesh used in adaptive integration [42] to calculate the view factor between
the two surfaces is shown in Fig. 5.35. The view factor V 12 was 0.3955 when void
fraction α f was 0.39 for dense packing, and V 12 was 0.3561 when α f was 0.44
for loose packing in nuclear-packed pebble beds. The solid conductivity of spheres
can be found in [21, 35]. By the comparison shown in Fig. 5.35, Sub-Cell radiation
Model (SCM) accords well with the Kunii–Smith correlation, especially at very high
temperature ranges (over 1,500
◦ C).
5.3.8.4 Demonstrative Application of SCM
For the experiments of packed pebble beds, a Sub-Cell radiation Model (SCM) can
be applied to investigating the effective thermal conductivity and the temperature
profile. In the HTTU experiment [21], the inner and outer radii of the cylindrical
packed pebble bed were 300 mm and 1150 mm, respectively. The height of the bed
was 1,200 mm. There were about 25,000 mono-sized (60 mm in diameter) machined
graphite pebbles in the system, and the average void fraction was 0.3915. The gas
filled in the pebble bed was the nitrogen at rather low pressure (about 10 kPa). The
inner wall was heated by the element heaters, and the stem coolers were placed at
the outer wall.
There was no heat source for the spheres, and the effect of the natural convection
was far less than other processes. The total effective thermal conductivity of the whole
bed (k eff ) included two independent parts, i.e., particle–particle conduction (k c ) and
particle radiation (k r ). The conduction part was hardly affected by the temperature
[47] and k c = 2.0 W/(m·K) for HTTU [5, 21].