

4.2 Gravity-Driven Flow Regime Characterization
195
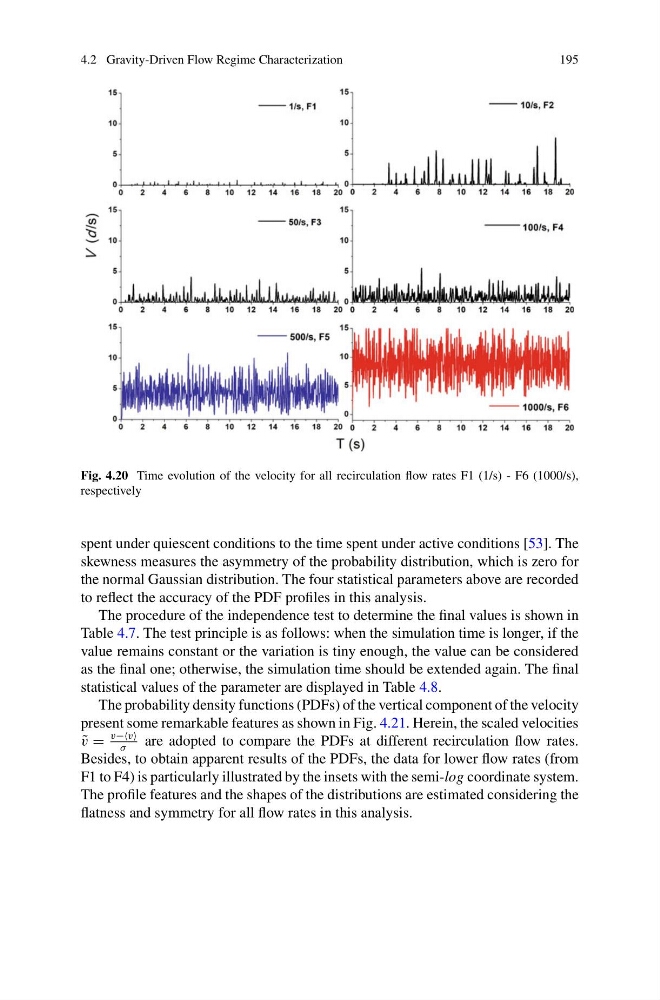
Fig. 4.20 Time evolution of the velocity for all recirculation flow rates F1 (1/s) - F6 (1000/s),
respectively
spent under quiescent conditions to the time spent under active conditions [53]. The
skewness measures the asymmetry of the probability distribution, which is zero for
the normal Gaussian distribution. The four statistical parameters above are recorded
to reflect the accuracy of the PDF profiles in this analysis.
The procedure of the independence test to determine the final values is shown in
Table 4.7. The test principle is as follows: when the simulation time is longer, if the
value remains constant or the variation is tiny enough, the value can be considered
as the final one; otherwise, the simulation time should be extended again. The final
statistical values of the parameter are displayed in Table 4.8.
The probability density functions (PDFs) of the vertical component of the velocity
present some remarkable features as shown in Fig. 4.21. Herein, the scaled velocities
˜
v =
v−−v
σ
are adopted to compare the PDFs at different recirculation flow rates.
Besides, to obtain apparent results of the PDFs, the data for lower flow rates (from
F1 to F4) is particularly illustrated by the insets with the semi-log coordinate system.
The profile features and the shapes of the distributions are estimated considering the
flatness and symmetry for all flow rates in this analysis.
195
Fig. 4.20 Time evolution of the velocity for all recirculation flow rates F1 (1/s) - F6 (1000/s),
respectively
spent under quiescent conditions to the time spent under active conditions [53]. The
skewness measures the asymmetry of the probability distribution, which is zero for
the normal Gaussian distribution. The four statistical parameters above are recorded
to reflect the accuracy of the PDF profiles in this analysis.
The procedure of the independence test to determine the final values is shown in
Table 4.7. The test principle is as follows: when the simulation time is longer, if the
value remains constant or the variation is tiny enough, the value can be considered
as the final one; otherwise, the simulation time should be extended again. The final
statistical values of the parameter are displayed in Table 4.8.
The probability density functions (PDFs) of the vertical component of the velocity
present some remarkable features as shown in Fig. 4.21. Herein, the scaled velocities
˜
v =
v−−v
σ
are adopted to compare the PDFs at different recirculation flow rates.
Besides, to obtain apparent results of the PDFs, the data for lower flow rates (from
F1 to F4) is particularly illustrated by the insets with the semi-log coordinate system.
The profile features and the shapes of the distributions are estimated considering the
flatness and symmetry for all flow rates in this analysis.