

192
4 Numerical Methods and Simulation for Pebble Flows
Validation by Experiments
First, experimental data [52], of particle field are used for comparison and validation, where a general agreement between the experiment and simulation results is
shown. For easy comparison here, a velocity field v(h, x) is constructed by coarsegraining individual particles’ velocities u(r, t) over a box of size 1.5d ×1.5d and
time interval T
v(h, x) =
1
T
T
i=1
⎡
⎣ 1
N (t i )
N (t i )
j=1
u j (r, t i )
⎤
⎦ ,
(4.22)
where N (t i ) is the number of particles, which lie inside a box centered at (h, x) at
time t i . Herein, a total of 3,300 frames of the experiment data are post-processed,
and nearly 6,000 particles are obtained.
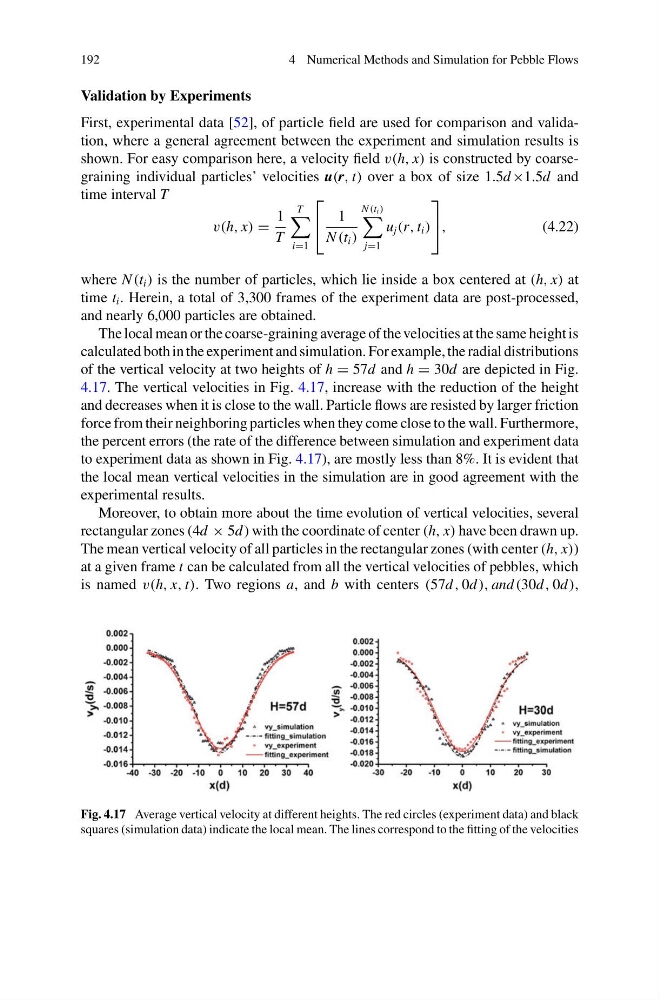
The local mean or the coarse-graining average of the velocities at the same height is
calculated both in the experiment and simulation. For example, the radial distributions
of the vertical velocity at two heights of h = 57d and h = 30d are depicted in Fig.
4.17. The vertical velocities in Fig. 4.17, increase with the reduction of the height
and decreases when it is close to the wall. Particle flows are resisted by larger friction
force from their neighboring particles when they come close to the wall. Furthermore,
the percent errors (the rate of the difference between simulation and experiment data
to experiment data as shown in Fig. 4.17), are mostly less than 8%. It is evident that
the local mean vertical velocities in the simulation are in good agreement with the
experimental results.
Moreover, to obtain more about the time evolution of vertical velocities, several
rectangular zones (4d × 5d ) with the coordinate of center (h, x) have been drawn up.
The mean vertical velocity of all particles in the rectangular zones (with center (h, x))
at a given frame t can be calculated from all the vertical velocities of pebbles, which
is named v(h, x, t). Two regions a, and b with centers (57d , 0d ), and (30d , 0d ),
Fig. 4.17 Average vertical velocity at different heights. The red circles (experiment data) and black
squares (simulation data) indicate the local mean. The lines correspond to the fitting of the velocities
4 Numerical Methods and Simulation for Pebble Flows
Validation by Experiments
First, experimental data [52], of particle field are used for comparison and validation, where a general agreement between the experiment and simulation results is
shown. For easy comparison here, a velocity field v(h, x) is constructed by coarsegraining individual particles’ velocities u(r, t) over a box of size 1.5d ×1.5d and
time interval T
v(h, x) =
1
T
T
i=1
⎡
⎣ 1
N (t i )
N (t i )
j=1
u j (r, t i )
⎤
⎦ ,
(4.22)
where N (t i ) is the number of particles, which lie inside a box centered at (h, x) at
time t i . Herein, a total of 3,300 frames of the experiment data are post-processed,
and nearly 6,000 particles are obtained.
The local mean or the coarse-graining average of the velocities at the same height is
calculated both in the experiment and simulation. For example, the radial distributions
of the vertical velocity at two heights of h = 57d and h = 30d are depicted in Fig.
4.17. The vertical velocities in Fig. 4.17, increase with the reduction of the height
and decreases when it is close to the wall. Particle flows are resisted by larger friction
force from their neighboring particles when they come close to the wall. Furthermore,
the percent errors (the rate of the difference between simulation and experiment data
to experiment data as shown in Fig. 4.17), are mostly less than 8%. It is evident that
the local mean vertical velocities in the simulation are in good agreement with the
experimental results.
Moreover, to obtain more about the time evolution of vertical velocities, several
rectangular zones (4d × 5d ) with the coordinate of center (h, x) have been drawn up.
The mean vertical velocity of all particles in the rectangular zones (with center (h, x))
at a given frame t can be calculated from all the vertical velocities of pebbles, which
is named v(h, x, t). Two regions a, and b with centers (57d , 0d ), and (30d , 0d ),
Fig. 4.17 Average vertical velocity at different heights. The red circles (experiment data) and black
squares (simulation data) indicate the local mean. The lines correspond to the fitting of the velocities