

4.2 Gravity-Driven Flow Regime Characterization
181
to the lowest value. Then, intense collisions happen and lead to a sharp increase in
the normal force. Finally, these pebbles pacify gradually, and the normal force also
returns to the previous level. Acceleration is determined by a total force consisting
of contact force and gravity force. The profile of the acceleration represents the
modulus without direction. This is why the value always stays a little above zero. The
maximum acceleration comes with the minimum normal contact force, which means
gravity is mainly responsible for this peak value of the acceleration. Concerning the
velocity profile, it is noted that the maximum velocity corresponds to the minimum
normal contact force, and the sharp deceleration results from the collisions with
increasing normal contact force.
A control volume that covers a majority of the pebble bed is set to watch and record
the kinetic energy (E(t)) of the system. The kinetic energies of pebbles are added
up to calculate the total kinetic energy of the control volume. As pebbles cannot
get to absolute stationary in DEM simulation, the E(t) profile shows a consistent
background noise around 1 × 10
−7 J. The magnitude of the background noise is
much lower than the energy level caused by the real pebble motion (above 1 × 10
−4
J), and it is verified that the details of the flow behavior will not be covered up and
the noise has no influence on the final conclusion through the frequency-amplitude
analysis of background noise. Hence, the energy threshold is not needed to distinguish
the noise in the current simulation. Moreover, the top surface of the pebble pile is
left out to exclude the influence of bouncing loaded pebbles (refer to Fig. 4.8). The
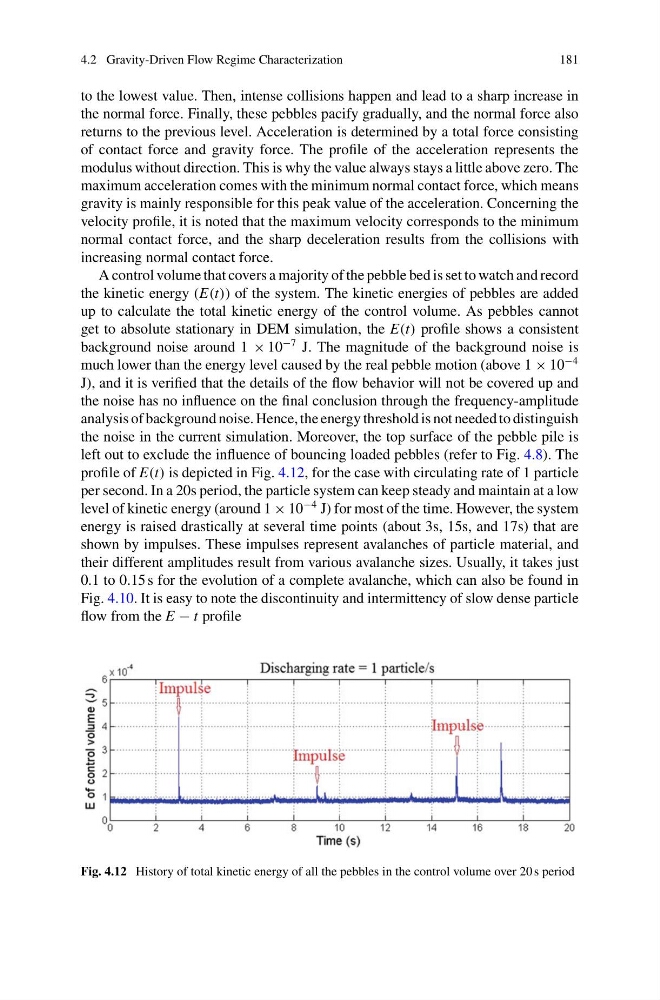
profile of E(t) is depicted in Fig. 4.12, for the case with circulating rate of 1 particle
per second. In a 20s period, the particle system can keep steady and maintain at a low
level of kinetic energy (around 1 × 10
−4 J) for most of the time. However, the system
energy is raised drastically at several time points (about 3s, 15s, and 17s) that are
shown by impulses. These impulses represent avalanches of particle material, and
their different amplitudes result from various avalanche sizes. Usually, it takes just
0.1 to 0.15 s for the evolution of a complete avalanche, which can also be found in
Fig. 4.10. It is easy to note the discontinuity and intermittency of slow dense particle
flow from the E − t profile
Fig. 4.12 History of total kinetic energy of all the pebbles in the control volume over 20 s period
181
to the lowest value. Then, intense collisions happen and lead to a sharp increase in
the normal force. Finally, these pebbles pacify gradually, and the normal force also
returns to the previous level. Acceleration is determined by a total force consisting
of contact force and gravity force. The profile of the acceleration represents the
modulus without direction. This is why the value always stays a little above zero. The
maximum acceleration comes with the minimum normal contact force, which means
gravity is mainly responsible for this peak value of the acceleration. Concerning the
velocity profile, it is noted that the maximum velocity corresponds to the minimum
normal contact force, and the sharp deceleration results from the collisions with
increasing normal contact force.
A control volume that covers a majority of the pebble bed is set to watch and record
the kinetic energy (E(t)) of the system. The kinetic energies of pebbles are added
up to calculate the total kinetic energy of the control volume. As pebbles cannot
get to absolute stationary in DEM simulation, the E(t) profile shows a consistent
background noise around 1 × 10
−7 J. The magnitude of the background noise is
much lower than the energy level caused by the real pebble motion (above 1 × 10
−4
J), and it is verified that the details of the flow behavior will not be covered up and
the noise has no influence on the final conclusion through the frequency-amplitude
analysis of background noise. Hence, the energy threshold is not needed to distinguish
the noise in the current simulation. Moreover, the top surface of the pebble pile is
left out to exclude the influence of bouncing loaded pebbles (refer to Fig. 4.8). The
profile of E(t) is depicted in Fig. 4.12, for the case with circulating rate of 1 particle
per second. In a 20s period, the particle system can keep steady and maintain at a low
level of kinetic energy (around 1 × 10
−4 J) for most of the time. However, the system
energy is raised drastically at several time points (about 3s, 15s, and 17s) that are
shown by impulses. These impulses represent avalanches of particle material, and
their different amplitudes result from various avalanche sizes. Usually, it takes just
0.1 to 0.15 s for the evolution of a complete avalanche, which can also be found in
Fig. 4.10. It is easy to note the discontinuity and intermittency of slow dense particle
flow from the E − t profile
Fig. 4.12 History of total kinetic energy of all the pebbles in the control volume over 20 s period