

178
4 Numerical Methods and Simulation for Pebble Flows
Table 4.3 Parameters used in simulation
Dimension of bed D x × D y × D z (mm)
800 × 1200 × 30
Diameter of the discharging hole D out (mm)
120
Base cone angle θ ◦
30
Pebble diameter d p (mm)
12
Pebble number N p (mm)
13090
Pebble density ρ p (kg/m 3 )
1700
Pebble friction coefficient μ p
0.1
Pebble restitution coefficient e p
0.90
Pebble Youngs modulus E p
6 × 10 7
Pebble Poisson rate ν p
0.35
Wall friction coefficient μ w
0.1
Wall Youngs modulus E w
6 × 10 8
Wall Poisson rate ν w
0.23
Time step δt (s)
5 × 10 −5
Total simulated time t T (s)
20, 40–160, 500, 1000
Circulating rate of pebbles r c (s −1 )
1, 5, 10–1500, 2500
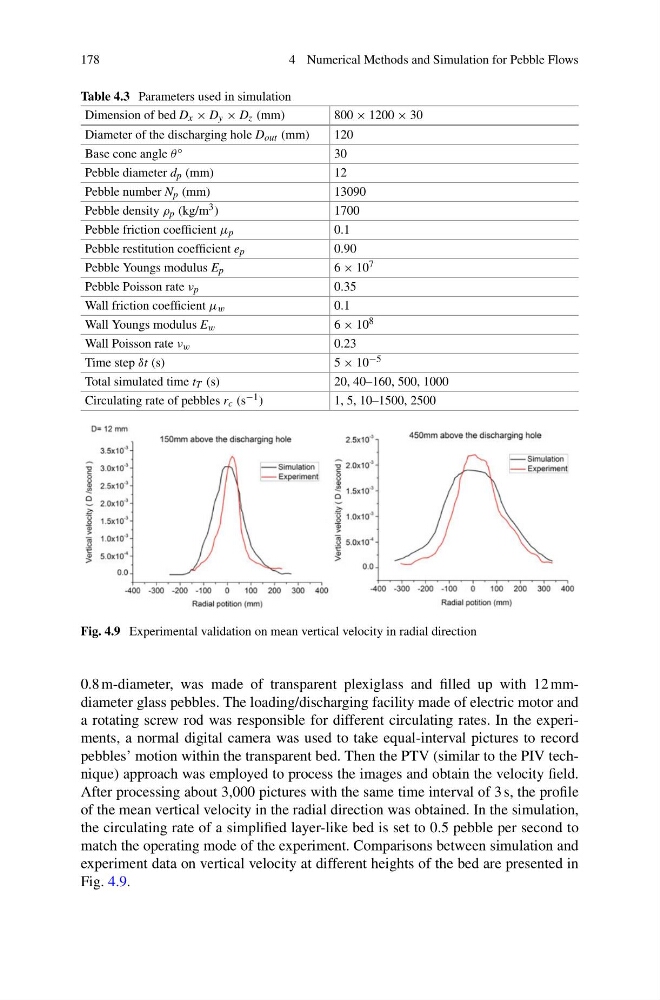
Fig. 4.9 Experimental validation on mean vertical velocity in radial direction
0.8 m-diameter, was made of transparent plexiglass and filled up with 12 mmdiameter glass pebbles. The loading/discharging facility made of electric motor and
a rotating screw rod was responsible for different circulating rates. In the experiments, a normal digital camera was used to take equal-interval pictures to record
pebbles’ motion within the transparent bed. Then the PTV (similar to the PIV technique) approach was employed to process the images and obtain the velocity field.
After processing about 3,000 pictures with the same time interval of 3 s, the profile
of the mean vertical velocity in the radial direction was obtained. In the simulation,
the circulating rate of a simplified layer-like bed is set to 0.5 pebble per second to
match the operating mode of the experiment. Comparisons between simulation and
experiment data on vertical velocity at different heights of the bed are presented in
Fig. 4.9.
4 Numerical Methods and Simulation for Pebble Flows
Table 4.3 Parameters used in simulation
Dimension of bed D x × D y × D z (mm)
800 × 1200 × 30
Diameter of the discharging hole D out (mm)
120
Base cone angle θ ◦
30
Pebble diameter d p (mm)
12
Pebble number N p (mm)
13090
Pebble density ρ p (kg/m 3 )
1700
Pebble friction coefficient μ p
0.1
Pebble restitution coefficient e p
0.90
Pebble Youngs modulus E p
6 × 10 7
Pebble Poisson rate ν p
0.35
Wall friction coefficient μ w
0.1
Wall Youngs modulus E w
6 × 10 8
Wall Poisson rate ν w
0.23
Time step δt (s)
5 × 10 −5
Total simulated time t T (s)
20, 40–160, 500, 1000
Circulating rate of pebbles r c (s −1 )
1, 5, 10–1500, 2500
Fig. 4.9 Experimental validation on mean vertical velocity in radial direction
0.8 m-diameter, was made of transparent plexiglass and filled up with 12 mmdiameter glass pebbles. The loading/discharging facility made of electric motor and
a rotating screw rod was responsible for different circulating rates. In the experiments, a normal digital camera was used to take equal-interval pictures to record
pebbles’ motion within the transparent bed. Then the PTV (similar to the PIV technique) approach was employed to process the images and obtain the velocity field.
After processing about 3,000 pictures with the same time interval of 3 s, the profile
of the mean vertical velocity in the radial direction was obtained. In the simulation,
the circulating rate of a simplified layer-like bed is set to 0.5 pebble per second to
match the operating mode of the experiment. Comparisons between simulation and
experiment data on vertical velocity at different heights of the bed are presented in
Fig. 4.9.