

174
4 Numerical Methods and Simulation for Pebble Flows
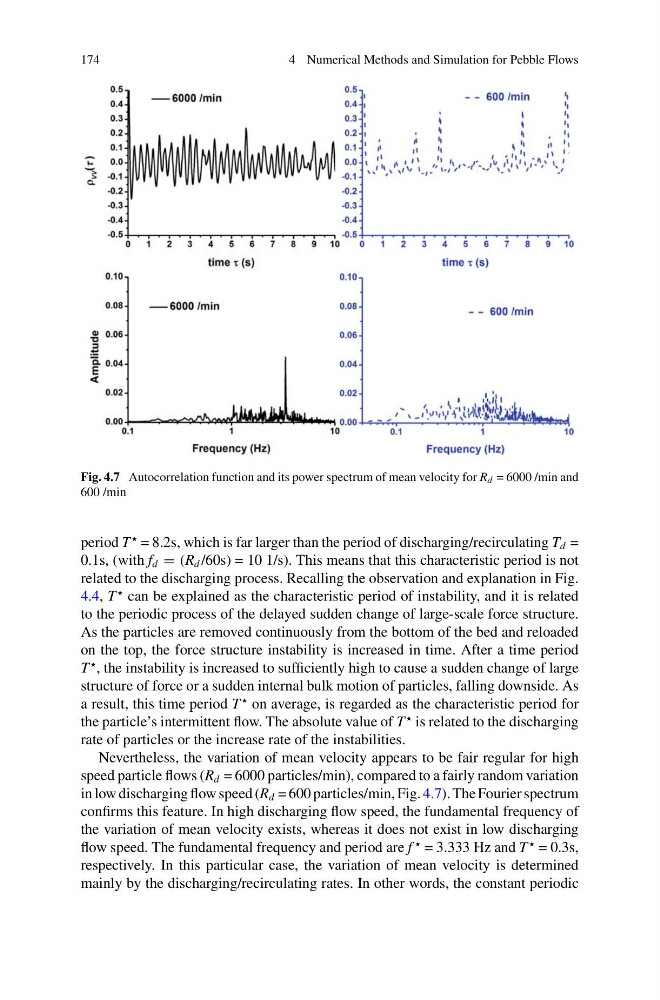
Fig. 4.7 Autocorrelation function and its power spectrum of mean velocity for R d = 6000 /min and
600 /min
period T
= 8.2s, which is far larger than the period of discharging/recirculating T d =
0.1s, (with f d = (R d /60s) = 10 1/s). This means that this characteristic period is not
related to the discharging process. Recalling the observation and explanation in Fig.
4.4, T
can be explained as the characteristic period of instability, and it is related
to the periodic process of the delayed sudden change of large-scale force structure.
As the particles are removed continuously from the bottom of the bed and reloaded
on the top, the force structure instability is increased in time. After a time period
T
, the instability is increased to sufficiently high to cause a sudden change of large
structure of force or a sudden internal bulk motion of particles, falling downside. As
a result, this time period T
on average, is regarded as the characteristic period for
the particle’s intermittent flow. The absolute value of T
is related to the discharging
rate of particles or the increase rate of the instabilities.
Nevertheless, the variation of mean velocity appears to be fair regular for high
speed particle flows (R d = 6000 particles/min), compared to a fairly random variation
in low discharging flow speed (R d = 600 particles/min, Fig. 4.7). The Fourier spectrum
confirms this feature. In high discharging flow speed, the fundamental frequency of
the variation of mean velocity exists, whereas it does not exist in low discharging
flow speed. The fundamental frequency and period are f
= 3.333 Hz and T
= 0.3s,
respectively. In this particular case, the variation of mean velocity is determined
mainly by the discharging/recirculating rates. In other words, the constant periodic
4 Numerical Methods and Simulation for Pebble Flows
Fig. 4.7 Autocorrelation function and its power spectrum of mean velocity for R d = 6000 /min and
600 /min
period T
= 8.2s, which is far larger than the period of discharging/recirculating T d =
0.1s, (with f d = (R d /60s) = 10 1/s). This means that this characteristic period is not
related to the discharging process. Recalling the observation and explanation in Fig.
4.4, T
can be explained as the characteristic period of instability, and it is related
to the periodic process of the delayed sudden change of large-scale force structure.
As the particles are removed continuously from the bottom of the bed and reloaded
on the top, the force structure instability is increased in time. After a time period
T
, the instability is increased to sufficiently high to cause a sudden change of large
structure of force or a sudden internal bulk motion of particles, falling downside. As
a result, this time period T
on average, is regarded as the characteristic period for
the particle’s intermittent flow. The absolute value of T
is related to the discharging
rate of particles or the increase rate of the instabilities.
Nevertheless, the variation of mean velocity appears to be fair regular for high
speed particle flows (R d = 6000 particles/min), compared to a fairly random variation
in low discharging flow speed (R d = 600 particles/min, Fig. 4.7). The Fourier spectrum
confirms this feature. In high discharging flow speed, the fundamental frequency of
the variation of mean velocity exists, whereas it does not exist in low discharging
flow speed. The fundamental frequency and period are f
= 3.333 Hz and T
= 0.3s,
respectively. In this particular case, the variation of mean velocity is determined
mainly by the discharging/recirculating rates. In other words, the constant periodic