

4.2 Gravity-Driven Flow Regime Characterization
173
as
C φφ (τ ) =
1
t T
t T
0
φ(t)φ(t − τ )dt,
(4.17)
where φ denotes any variable with expectation E(φ) = 0. The correlation function is
normalized by the variance of φ to obtain the dimensionless correlation coefficient
ρ φφ . The fast Fourier transformation of C φφ is the so-called power spectrum
S φφ (ω) =
t T
0
C φφ (τ )e
jωτ d τ,
(4.18)
which illustrates the power distribution characteristics.
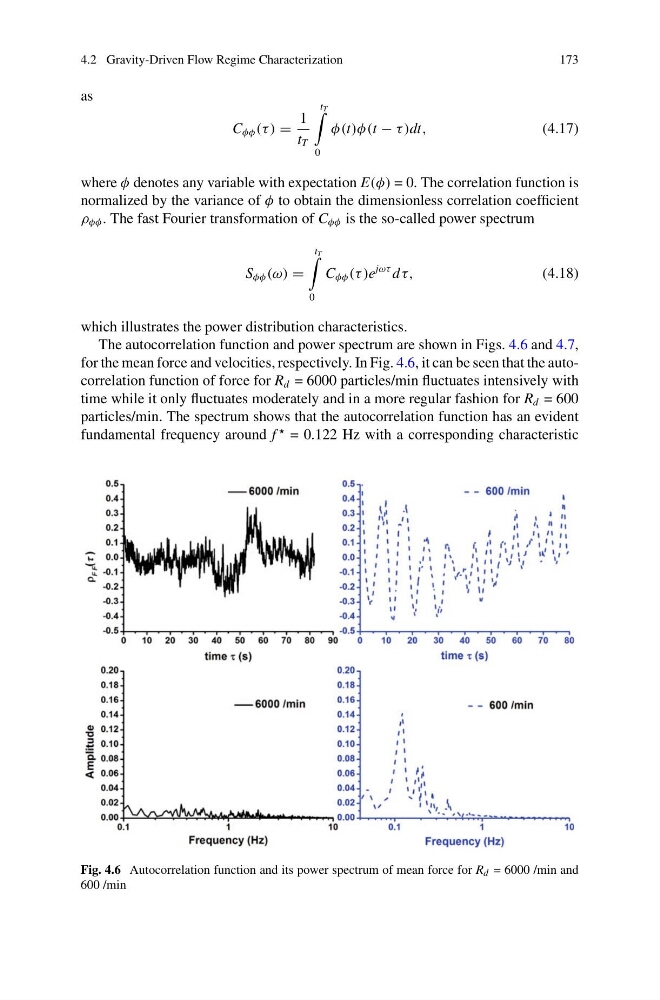
The autocorrelation function and power spectrum are shown in Figs. 4.6 and 4.7,
for the mean force and velocities, respectively. In Fig. 4.6, it can be seen that the autocorrelation function of force for R d = 6000 particles/min fluctuates intensively with
time while it only fluctuates moderately and in a more regular fashion for R d = 600
particles/min. The spectrum shows that the autocorrelation function has an evident
fundamental frequency around f
= 0.122 Hz with a corresponding characteristic
Fig. 4.6 Autocorrelation function and its power spectrum of mean force for R d = 6000 /min and
600 /min
173
as
C φφ (τ ) =
1
t T
t T
0
φ(t)φ(t − τ )dt,
(4.17)
where φ denotes any variable with expectation E(φ) = 0. The correlation function is
normalized by the variance of φ to obtain the dimensionless correlation coefficient
ρ φφ . The fast Fourier transformation of C φφ is the so-called power spectrum
S φφ (ω) =
t T
0
C φφ (τ )e
jωτ d τ,
(4.18)
which illustrates the power distribution characteristics.
The autocorrelation function and power spectrum are shown in Figs. 4.6 and 4.7,
for the mean force and velocities, respectively. In Fig. 4.6, it can be seen that the autocorrelation function of force for R d = 6000 particles/min fluctuates intensively with
time while it only fluctuates moderately and in a more regular fashion for R d = 600
particles/min. The spectrum shows that the autocorrelation function has an evident
fundamental frequency around f
= 0.122 Hz with a corresponding characteristic
Fig. 4.6 Autocorrelation function and its power spectrum of mean force for R d = 6000 /min and
600 /min