

106
2 Experiments in Pebble Flows
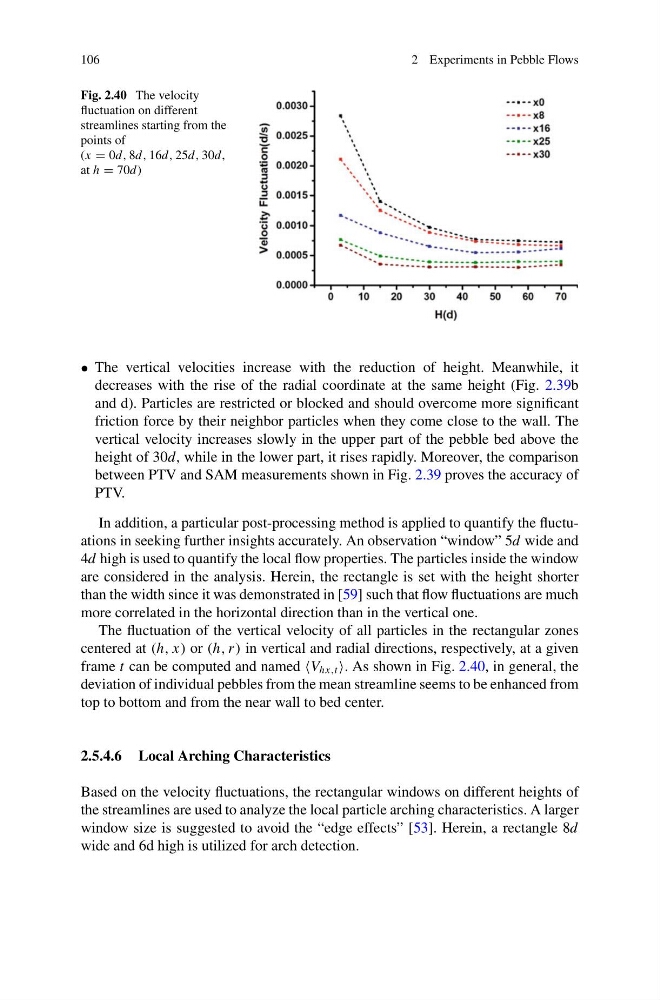
Fig. 2.40 The velocity
fluctuation on different
streamlines starting from the
points of
(x = 0d, 8d, 16d, 25d, 30d,
at h = 70d)
• The vertical velocities increase with the reduction of height. Meanwhile, it
decreases with the rise of the radial coordinate at the same height (Fig. 2.39b
and d). Particles are restricted or blocked and should overcome more significant
friction force by their neighbor particles when they come close to the wall. The
vertical velocity increases slowly in the upper part of the pebble bed above the
height of 30d, while in the lower part, it rises rapidly. Moreover, the comparison
between PTV and SAM measurements shown in Fig. 2.39 proves the accuracy of
PTV.
In addition, a particular post-processing method is applied to quantify the fluctuations in seeking further insights accurately. An observation “window” 5d wide and
4d high is used to quantify the local flow properties. The particles inside the window
are considered in the analysis. Herein, the rectangle is set with the height shorter
than the width since it was demonstrated in [59] such that flow fluctuations are much
more correlated in the horizontal direction than in the vertical one.
The fluctuation of the vertical velocity of all particles in the rectangular zones
centered at (h, x) or (h, r ) in vertical and radial directions, respectively, at a given
frame t can be computed and named V hx,t . As shown in Fig. 2.40, in general, the
deviation of individual pebbles from the mean streamline seems to be enhanced from
top to bottom and from the near wall to bed center.
2.5.4.6 Local Arching Characteristics
Based on the velocity fluctuations, the rectangular windows on different heights of
the streamlines are used to analyze the local particle arching characteristics. A larger
window size is suggested to avoid the “edge effects” [53]. Herein, a rectangle 8d
wide and 6d high is utilized for arch detection.
2 Experiments in Pebble Flows
Fig. 2.40 The velocity
fluctuation on different
streamlines starting from the
points of
(x = 0d, 8d, 16d, 25d, 30d,
at h = 70d)
• The vertical velocities increase with the reduction of height. Meanwhile, it
decreases with the rise of the radial coordinate at the same height (Fig. 2.39b
and d). Particles are restricted or blocked and should overcome more significant
friction force by their neighbor particles when they come close to the wall. The
vertical velocity increases slowly in the upper part of the pebble bed above the
height of 30d, while in the lower part, it rises rapidly. Moreover, the comparison
between PTV and SAM measurements shown in Fig. 2.39 proves the accuracy of
PTV.
In addition, a particular post-processing method is applied to quantify the fluctuations in seeking further insights accurately. An observation “window” 5d wide and
4d high is used to quantify the local flow properties. The particles inside the window
are considered in the analysis. Herein, the rectangle is set with the height shorter
than the width since it was demonstrated in [59] such that flow fluctuations are much
more correlated in the horizontal direction than in the vertical one.
The fluctuation of the vertical velocity of all particles in the rectangular zones
centered at (h, x) or (h, r ) in vertical and radial directions, respectively, at a given
frame t can be computed and named V hx,t . As shown in Fig. 2.40, in general, the
deviation of individual pebbles from the mean streamline seems to be enhanced from
top to bottom and from the near wall to bed center.
2.5.4.6 Local Arching Characteristics
Based on the velocity fluctuations, the rectangular windows on different heights of
the streamlines are used to analyze the local particle arching characteristics. A larger
window size is suggested to avoid the “edge effects” [53]. Herein, a rectangle 8d
wide and 6d high is utilized for arch detection.