

2.5 Particle Velocimetry Measurements
103
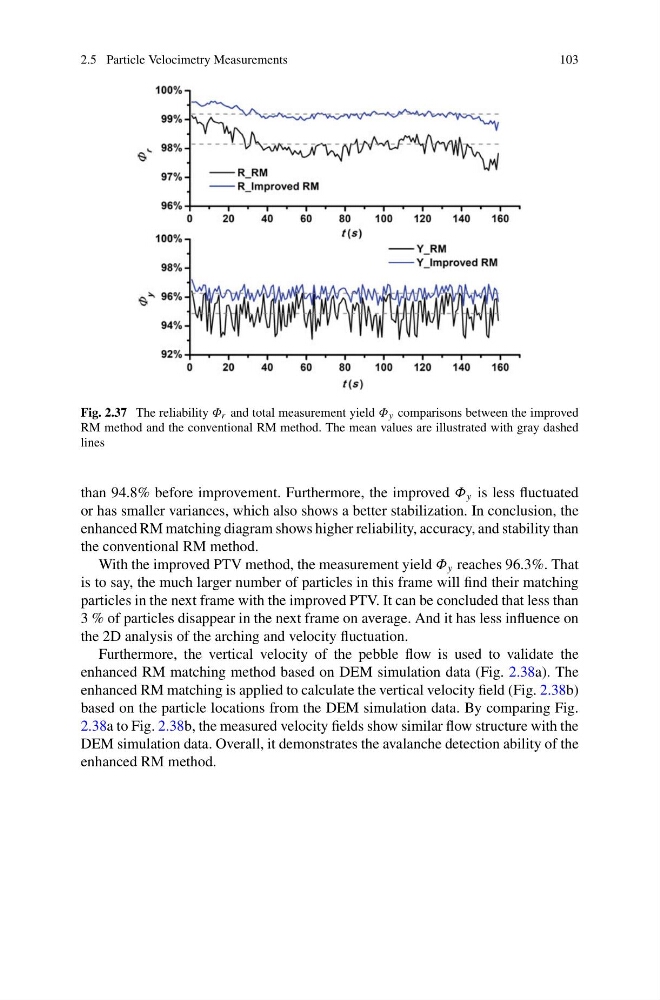
Fig. 2.37 The reliability Φ r and total measurement yield Φ y comparisons between the improved
RM method and the conventional RM method. The mean values are illustrated with gray dashed
lines
than 94.8% before improvement. Furthermore, the improved Φ y is less fluctuated
or has smaller variances, which also shows a better stabilization. In conclusion, the
enhanced RM matching diagram shows higher reliability, accuracy, and stability than
the conventional RM method.
With the improved PTV method, the measurement yield Φ y reaches 96.3%. That
is to say, the much larger number of particles in this frame will find their matching
particles in the next frame with the improved PTV. It can be concluded that less than
3 % of particles disappear in the next frame on average. And it has less influence on
the 2D analysis of the arching and velocity fluctuation.
Furthermore, the vertical velocity of the pebble flow is used to validate the
enhanced RM matching method based on DEM simulation data (Fig. 2.38a). The
enhanced RM matching is applied to calculate the vertical velocity field (Fig. 2.38b)
based on the particle locations from the DEM simulation data. By comparing Fig.
2.38a to Fig. 2.38b, the measured velocity fields show similar flow structure with the
DEM simulation data. Overall, it demonstrates the avalanche detection ability of the
enhanced RM method.
103
Fig. 2.37 The reliability Φ r and total measurement yield Φ y comparisons between the improved
RM method and the conventional RM method. The mean values are illustrated with gray dashed
lines
than 94.8% before improvement. Furthermore, the improved Φ y is less fluctuated
or has smaller variances, which also shows a better stabilization. In conclusion, the
enhanced RM matching diagram shows higher reliability, accuracy, and stability than
the conventional RM method.
With the improved PTV method, the measurement yield Φ y reaches 96.3%. That
is to say, the much larger number of particles in this frame will find their matching
particles in the next frame with the improved PTV. It can be concluded that less than
3 % of particles disappear in the next frame on average. And it has less influence on
the 2D analysis of the arching and velocity fluctuation.
Furthermore, the vertical velocity of the pebble flow is used to validate the
enhanced RM matching method based on DEM simulation data (Fig. 2.38a). The
enhanced RM matching is applied to calculate the vertical velocity field (Fig. 2.38b)
based on the particle locations from the DEM simulation data. By comparing Fig.
2.38a to Fig. 2.38b, the measured velocity fields show similar flow structure with the
DEM simulation data. Overall, it demonstrates the avalanche detection ability of the
enhanced RM method.